by Dave Senf
April 2013
Note: All data except for Minnesota's PMI have been seasonally adjusted. See the feature article in the Minnesota Employment Review, May 2010, for more information on the Minnesota Index.
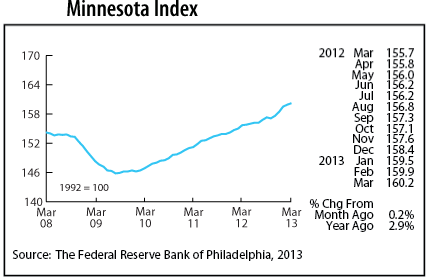
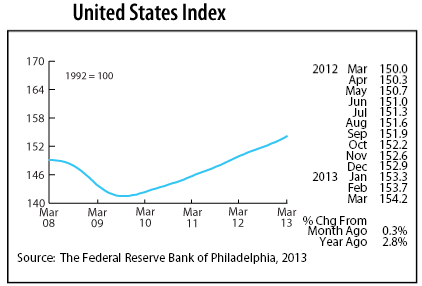
The Minnesota Index, after shifting into high gear in December and January, has downshifted during the last two months. The index advanced 0.2 percent in March, matching February's pace. The unemployment rate inched down and manufacturing hours spiked, but the index was held back by declining employment. The index, which is a monthly measure of economic activity in the state, increased 1.1 percent in the first quarter compared to 1.0 percent during the first quarter last year.
The U.S. index increased 0.3 percent for the third month in a row in March, pushing U.S. economic growth over the first quarter up to 0.8 percent. Minnesota's index, after running ahead of the national index for most of the last half of 2012, has slipped slightly behind the national pace over the last two months. Minnesota's economy, as measured by the index, is up 2.9 percent from a year ago while the U.S. economy is up 2.8 percent.
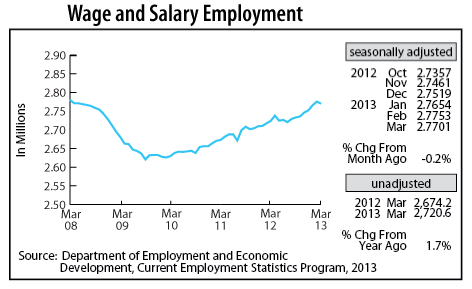
Minnesota's Wage and Salary Employment dipped for the first time in eight months, slipping 0.2 percent in March. Goods-producing industries added 400 jobs while service-providing industries combined to cut 5,600 positions leaving a net job loss of 5,200. Job cutbacks were highest in Educational and Health Services, Leisure and Hospitality, and Government. Trade, Transportation, and Utilities, Construction, and Professional and Business Services were the only sectors to expand payrolls in March.
March's employment drop may be only a seasonal adjustment glitch arising from the colder than normal weather. The usual warmer weather hiring uptick may have been partially shifted to April and May. Minnesota's unadjusted over-the-year job growth slipped to a still robust 1.7 percent. Minnesota job growth exceeded the national rate for the third straight month as jobs nationally were 1.5 percent higher in March than last year.
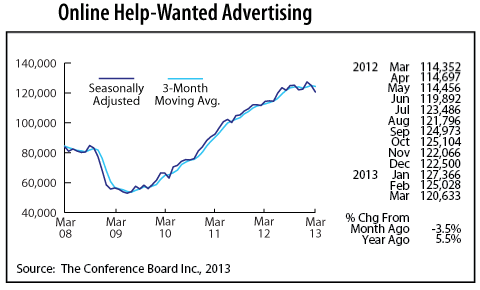
Minnesota's adjusted online Help-Wanted Ads stumbled for the second straight month, siding 3.5 percent in March. U.S. help-wanted ads were also down for the second consecutive month with ad levels sliding 3.1 percent from February. The consecutive monthly drops in Minnesota's online job advertising is the first since the middle of 2009 right before the bleeding of jobs during the Great Recession ended. The drop in total employment and in online help-wanted ads were the only two negative indicators in March.
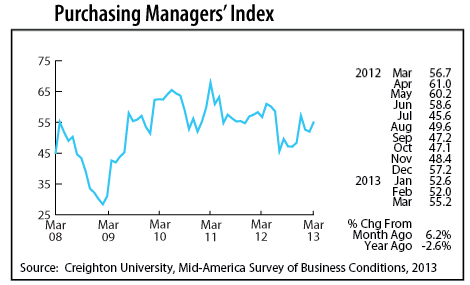
Minnesota's Purchasing Managers' Index (PMI) reversed a two month slide in March, jumping to 55.2. The positive reading points towards a pickup in manufacturing activity in Minnesota in the months ahead. The employment component of the index has been above 50 for five months now suggesting that manufacturing hiring should pick up over the next few months. Manufacturing payrolls expanded by 2.7 percent in 2011 but only 1.6 percent last year. Minnesota manufacturers have recovered only 18,000 of the 50,000 lost during the Great Recession.
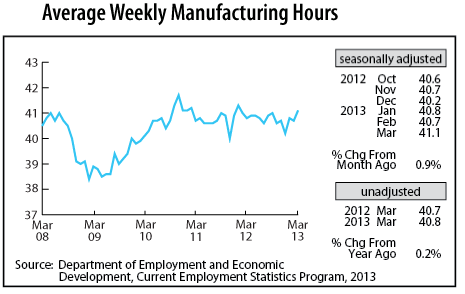
Adjusted Manufacturing Hours spiked up for the second time in three months in March pushing factory hours to their highest level since January 2012. March's 41.1 factory workweek is another sign that Minnesota's manufacturers are ramping up production. The longer workweek is another good indicator that hiring may be on the rise over the next few months.
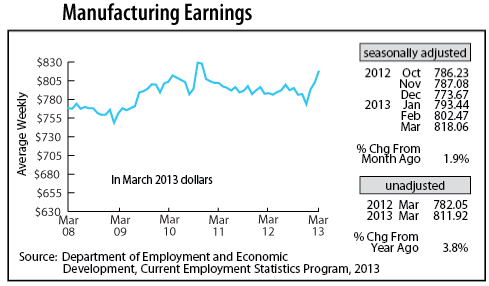
Adjusted Manufacturing Earnings were up for the third straight month in March boosted by the longer workweek. March's average earnings of $818.06 is the fattest paycheck in 28 months. Average manufacturing earnings after adjusting for inflation were 3.8 percent higher than a year ago.
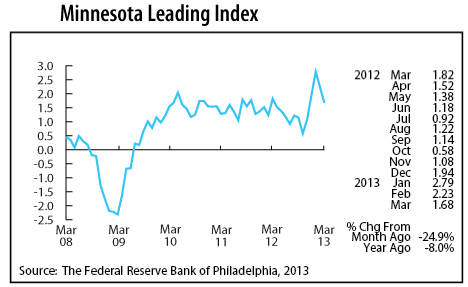
The Minnesota Leading Index, which skyrocketed up to its highest level since 1997 in January, has come back down to earth during the last two months. March's 1.68, however, is still a bullish sign for Minnesota's economy over the next six months. If the 1.68 reading is accurate and the economy remains strong through the second half of 2013, Minnesota may end the year with its largest GDP expansion since 2000.
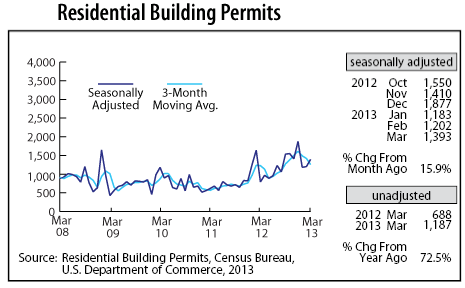
Adjusted Residential Building Permits rebounded in March, climbing 15.9 percent. Optimism and confidence in the home building industry continues to gain momentum as a shortage of home listings in the face of rising demand has home buyers turning to new home construction.
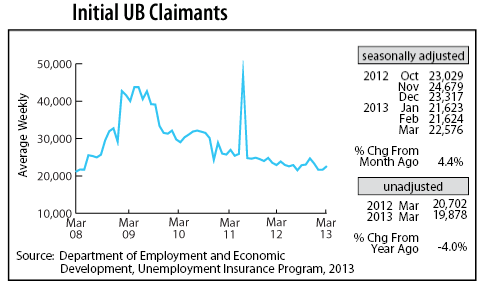
Adjusted Initial Claims for Unemployment Benefits (UB) inched upwards in March but remained relatively low, suggesting that the layoff rate remains subdued. Unadjusted initial claims are down 1.4 percent from last year, indicating that job growth is likely to rebound over the next few months as the weather warms up.