by Dave Senf
June 2015
Note: All data except for Minnesota's PMI have been seasonally adjusted. See the feature article in the Minnesota Employment Review, May 2010, for more information on the Minnesota Index.
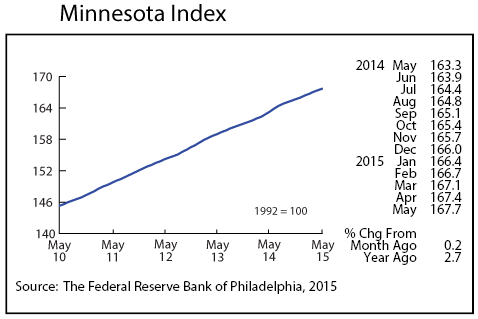
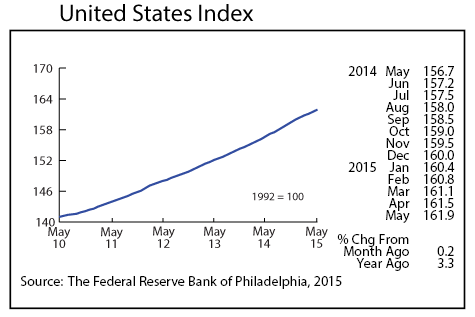
The Minnesota Index rose 0.2 percent for the 10th consecutive month in May, a sign that the Minnesota economy continues to expand but at a moderate rate. The U.S. index also rose 0.2 last month marking the fourth month in a row that the U.S. index climbed 0.2 percent. The Minnesota index has trailed the U.S. index in nine of the last 10 months, but the gap has been minimal in most months.
May's index advance was held in check in Minnesota by flat wage and salary employment and a small uptick in the unemployment rate, increasing from 3.7 to 3.8 percent. The uptick in the unemployment rate was not all negative as the labor force increased by roughly 6,500 workers with household employment increasing 3,400 and unemployment increasing 3,100. Labor force participation in Minnesota reached 70.8 percent, the highest level since September 2011. Minnesota's labor force participation rate is now 7.9 percentage points above the U.S. which is the highest gap since September 2009. The Minnesota index was up 2.7 percent over the last year while the U.S. index was up 3.3 over the same period.
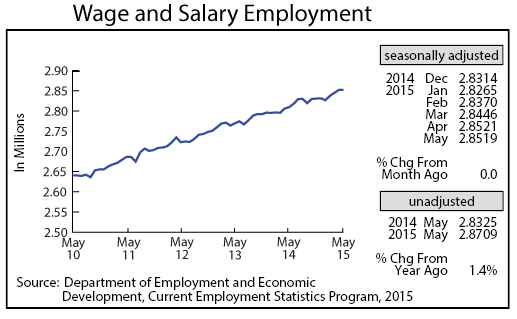
Adjusted Wage and Salary Employment, after recording sharp gains during the previous three months, was essentially unchanged as total employment inched down 200 jobs. Private sector payrolls fell by 500 positions while public sector payrolls expanded by 300 positions. Professional and Business Services, Leisure and Hospitality, and Manufacturing payrolls saw the biggest declines. Trade, Transportation, and Utilities added 6,600 jobs, offsetting most of the job loss in other sectors. The 6,600 job expansion in Trade, Transportation, and Utilities was the second largest monthly increase over the last 25 years. This sector's workforce hasn't been this large since May 2007.
Minnesota's unadjusted over-the-year job growth dipped to 1.4 percent in May while the U.S. rate stayed at 2.2 percent. Minnesota's job growth on a year-over-year basis has lagged behind the U.S. for almost a year now.
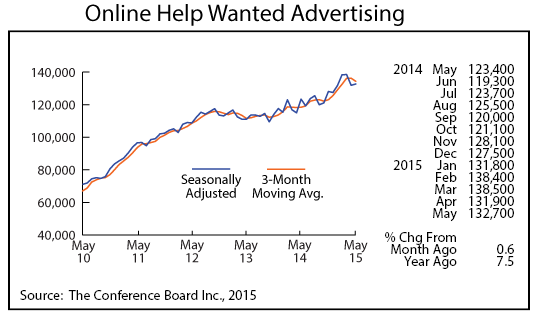
Minnesota's adjusted online Help-Wanted Ads inched up 0.6 percent in May. Help-wanted ad levels nationally rose 1.5 percent. Help-wanted advertising is up 7.5 percent from a year ago in Minnesota and 8.2 percent nationally. Minnesota's share of national online help-wanted ads (2.4 percent) continues to run ahead of the state's share of national employment, (2.0 percent).
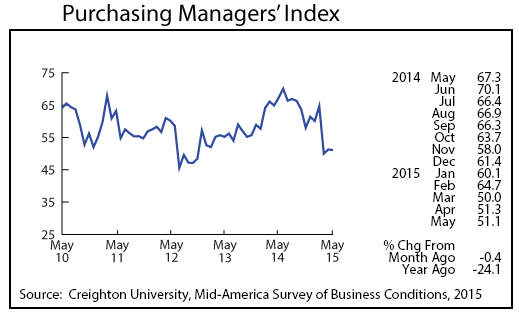
Minnesota's Purchasing Managers' Index (PMI) inched down to 51.1, slightly above the three-year low recorded in March. The Minnesota PMI, like the national PMI, ranges between 0 percent and 100 percent with an index number greater than 50 indicating an expansionary economy while a reading under 50 percent forecasting a sluggish economy over the next three to six months. Minnesota's index has trailed the U.S. PMI over the last three months, suggesting that Minnesota's manufacturing will expand slower than the national economy through the rest of the year. Minnesota's PMI ran significantly higher than the national PMI, yet Minnesota's manufacturing employment growth (1.5 percent) was only slightly higher than nationwide growth (1.4 percent).
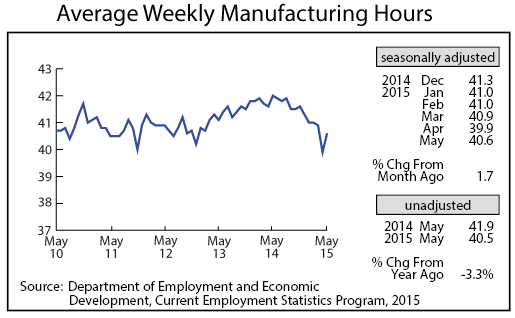
Adjusted Manufacturing Hours partially rebounded in May from a steep drop off in April. May's 40.6 hours was down from a year ago when the average factory workweek was 42.0 hours. The 45-year average for non-recession months is 40.6 hours and 39.7 hours for recession months. It is hard to tell if the lower hours are from slowing manufacturing activity or because the sector has added workers and cut overtime hours.
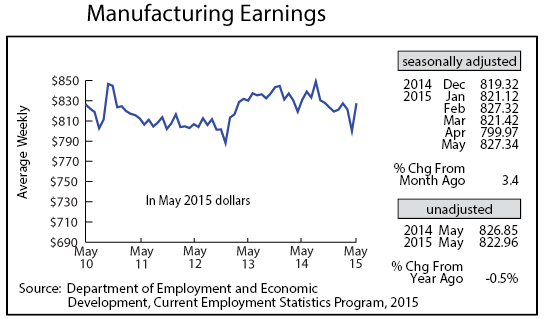
Manufacturing Earnings also rebounded in May, climbing to $827.34 but remain in real terms lower than a year ago.
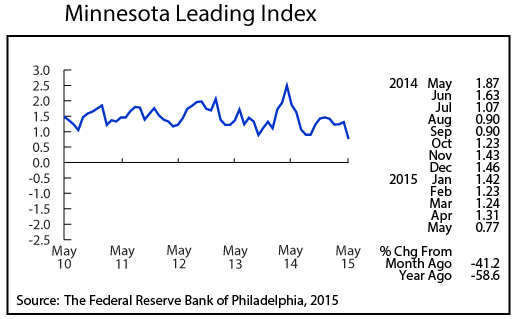
The Minnesota Leading Index was revised down significantly in May, declining to 0.77. That is the lowest reading since November 2009. May's reading indicates that Minnesota's GDP will expand by less than 1 percent over the next six months. Minnesota's leading index has trailed the national leading index over the last 12 months. The low reading isn't consistent with most of the other indicators so expect it to be revised up next month.
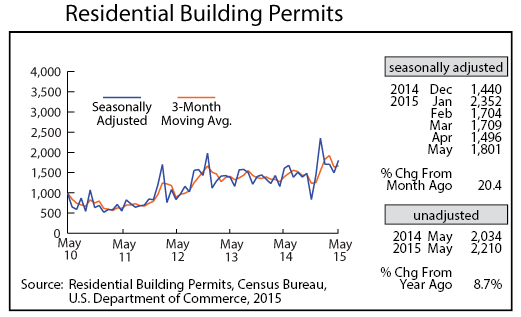
Adjusted Residential Building Permits bounced back in May, climbing 20.4 percent to 1,801. Minnesota's home-building industry is still below the historical average, but residential building permits over the first five months of this year are the highest since 2006.
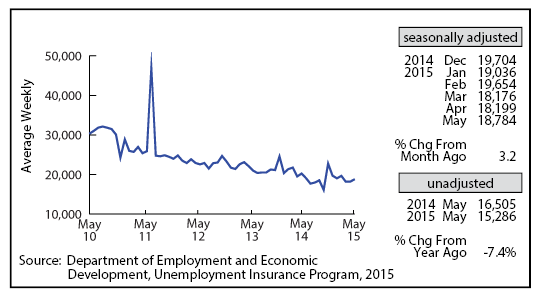
Adjusted Initial Claims for Unemployment Benefits (UB) climbed 3.2 percent in May but remain comfortably low which suggest that Minnesota's job market will remain solid through the summer.
