by Dave Senf
September 2017
Note: All data except for Minnesota’s PMI have been seasonally adjusted. See the feature article in the Minnesota Employment Review, May 2010, for more information on the Minnesota Index.
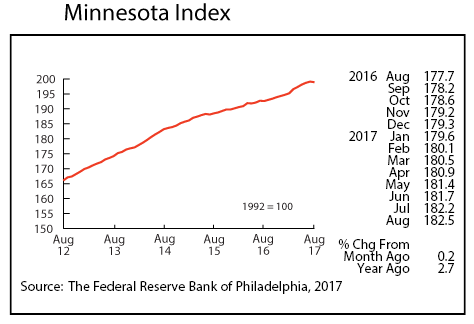
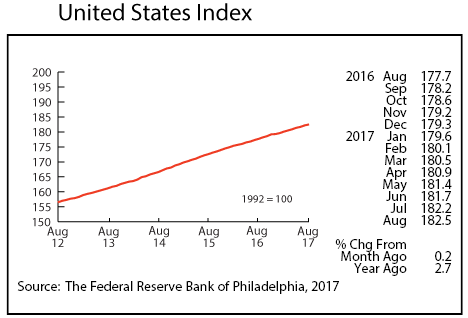
The Minnesota Index dropped for the first time since May 2016 in August, retreating 0.1 percent. The decline can be traced to a drop in wage and salary employment and the unemployment rate’s edging up. The U.S. index rose 0.2 percent. The Minnesota index, after accelerating in March and April, has downshifted, indicating that Minnesota’s economy isn’t expanding as fast as it was earlier in the year.
Minnesota’s index is up 3.2 percent over the year while the U.S. index is 2.7 percent higher than a year ago. Since the index is designed to measure economic growth, the 3.2 percent gain by the Minnesota index over the last 12 months suggests that Minnesota’s GDP has increased by 3.2 percent since August 2016.
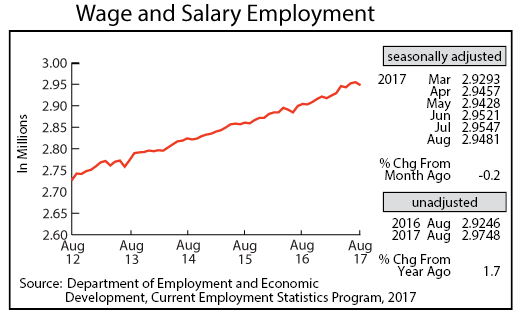
Minnesota’s adjusted Wage and Salary Employment decreased by 6,600 jobs in August. The 0.2 percent drop was the largest since last June and, combined with downward revisions to July’s employment numbers, indicates that Minnesota’s job market has cooled from its strong pace just a few months ago. All of the job loss was in the private sector as the public sector added 800 positions. Trade, Transportation, and Utilities added 3,200 jobs, but job cuts of 6,400 in Leisure and Hospitality and 5,300 in Educational and Health Services drove the overall decline.
Minnesota’s unadjusted over-the-year job growth fell to 1.7 in August but was higher than the national 1.5 percent job growth. The state’s over-the-year job growth has bettered the U.S. rate for the last four months. Minnesota’s annual average job growth will likely top last year’s average, while U.S. annual average job growth for 2017 looks likely to fall short of job growth in 2016.
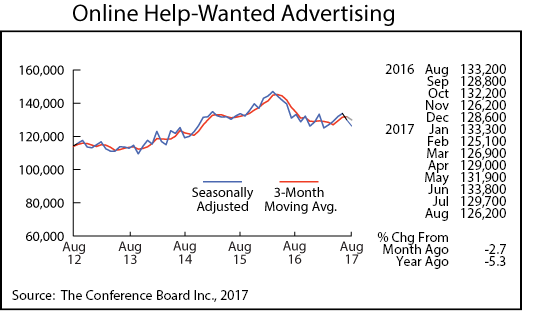
Online Help-Wanted Ads slipped for the second consecutive month in August, tailing off by 2.7 percent, the same drop as nationwide. Minnesota’s share of online job postings remained at 2.8 percent which is significantly higher than the state’s 2.0 percent share of national wage and salary employment. Minnesota employers continue to rank “trouble finding qualified workers” as one of their top worries.
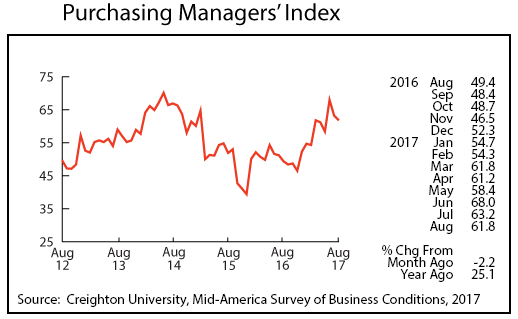
Minnesota’s Purchasing Managers’ Index (PMI) dipped for the second month in a row, sliding to a still healthy 61.8. Over the 23-year history of the PMI the index has been above 60 only 21 percent of the time. So any reading above 60 suggests manufacturing activity in the state is expanding at a good clip. The corresponding national index rose to 58.8 while the Mid-American index advanced to 57.5. The employment component of Minnesota’s index dropped below 60 for the first time since February, indicating that manufacturing hiring may be tailing off.
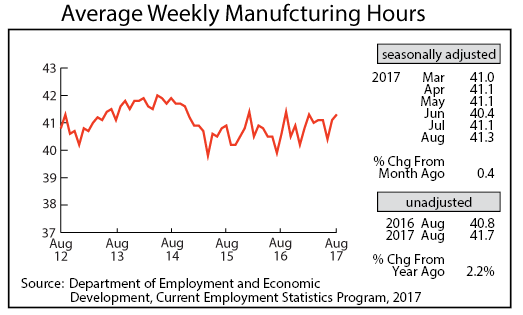
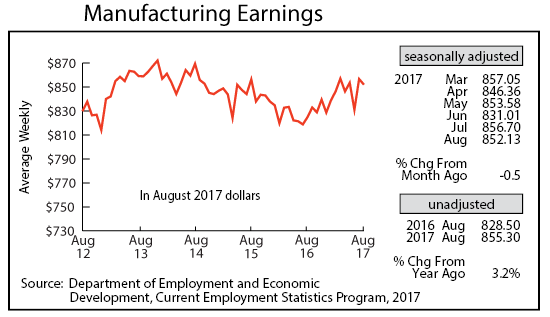
Adjusted Manufacturing Hours rose for the second straight month to 41.3. That’s the longest factory workweek since February. Average weekly Manufacturing Earnings, however, inched down, dipping to $852.13. The rebound in manufacturing this year will push annual average adjusted manufacturing earnings in 2017 above the previous two years but still below factory paychecks in 2014 when inflation is accounted for.
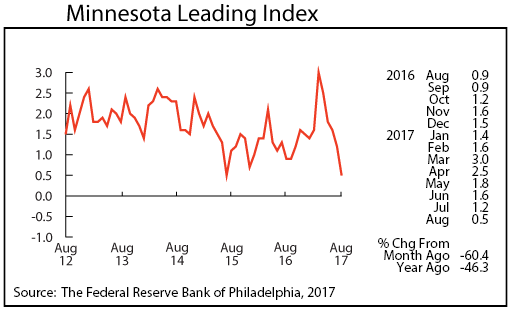
The Minnesota Leading Index, after hitting a six-year high in March, has been heading south, declining again in August for the fifth month in a row. August’s 0.5 reading was the lowest since July 2015. The low reading suggests that Minnesota’s economy will be slowing significantly over the next six months.
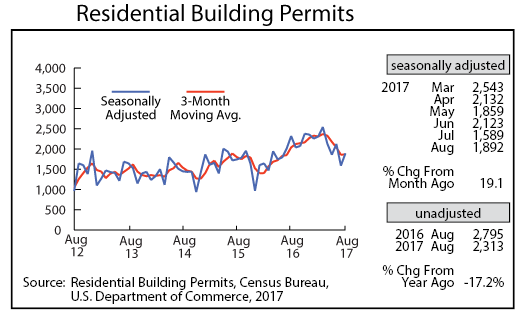
Adjusted Residential Building Permits rebounded partially in August but continued to fall short of the level experience during the first half of the year. August’s 1,892 was well under the 2,204 monthly average over the first six months of the year. Adjusted building permits were lower than a year ago for the second month in a row after having been higher than a year ago for 12 straight months. Based on sliding home building permits, construction job growth is likely to be curbed over the next few months.
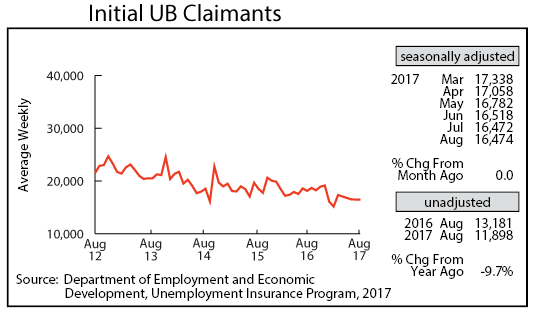
Adjusted Initial Claims for Unemployment Benefits (UB) were basically flat in August, coming in at 16,474. Initial claims through the first eight months of the year are down 9.0 percent from the same period last year. Minnesota’s unadjusted average monthly over-the-year job growth through the first eight months of 2017 is 1.8 percent. That tops the U.S. rate of 1.5 percent and all of the neighboring states – Iowa (0.9 percent), North Dakota (0.7 percent), South Dakota (1.2 percent), and Wisconsin (1.0 percent).