by Dave Senf
June 2017
Note: All data except for Minnesota’s PMI have been seasonally adjusted. See the feature article in the Minnesota Employment Review, May 2010, for more information on the Minnesota Index.
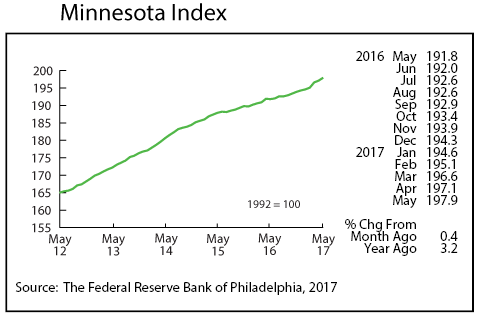
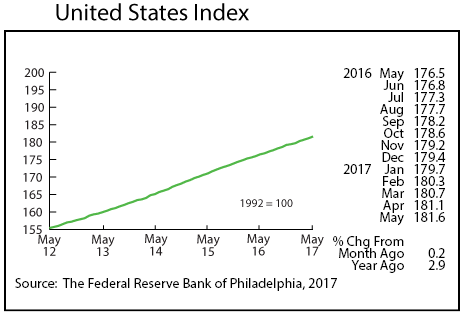
The Minnesota Index advanced by 0.4 percent in May, a slight uptick from the 0.3 percent in April. The index is up 1.8 percent since December which is the largest January-through-May increase since 2014. The index is designed to be a monthly proxy for the state’s gross domestic product (GDP). The U.S. index moved 0.2 percent higher in May.
Minnesota’s index is up 3.2 percent over-the-year, surpassing the 2.9 percent over the year rate for the U.S. Minnesota’s over-the-year increase hasn’t exceeded the U.S. by this much since May 2015. The average monthly over-the-year increase is 2.7 percent dating back to 1980, so May’s 3.2 percent reading suggests that economic activity in Minnesota over the last 12 months has been moderately stronger than average.
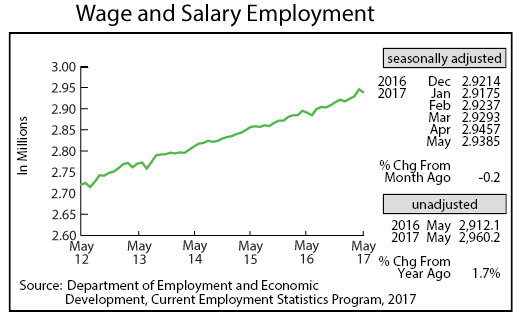
Minnesota’s adjusted Wage and Salary Employment recorded its largest decline in a year in May as 7,200 jobs were cut. The private sector reduced its payroll total by 4,600 while the public sector shed 2,600 positions. Job cuts occurred in seven of the 11 supersectors. Jobs were reduced the most in Construction, Government, Professional and Business Services, and Trade, Transportation, and Utilities. Job gains in Other Services and Manufacturing offset some of the job loss in other sectors.
Manufacturing recorded job growth for the fourth straight month, something the sector hasn’t done since early 2015. Other Services recorded its highest monthly jump over the last 27 years, expanding payroll numbers by 2,100. Minnesota’s unadjusted over-the-year job growth climbed back up to 1.7 percent in May, surpassing the 1.5 percent U.S. increase. Minnesota’s average over-the-year growth through the first five months of the year is 1.5 percent, the same as the U.S. growth rate.
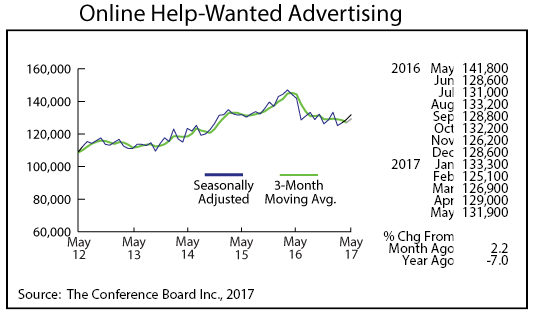
Online Help-Wanted Ads rose for the third consecutive month to 131,900 in May. May’s 2.2 percent increase in Minnesota lagged the 4.2 percent national gain in online job postings. Minnesota’s share of national online job advertising, however, continues to be higher than its share of wage and salary employment with the state accounting for 2.7 percent of online job ads and 2.0 percent of U.S. wage and salary employment. The healthy level of online job ads indicates that demand for labor remains solid in Minnesota and that job growth will remain in the 1.5 percent range over the next few months.
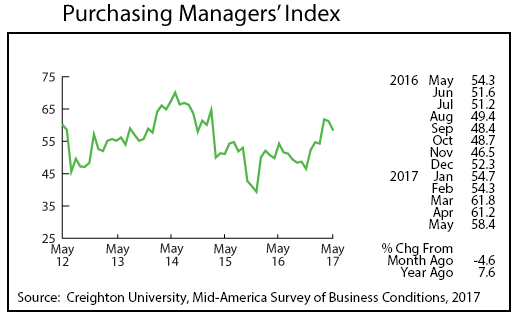
Minnesota’s Purchasing Managers’ Index (PMI) dipped for the second straight month, but the still healthy 58.4 reading indicates that Minnesota’s manufacturers continue to expect activity to expand solidly over the next six months. The corresponding national index inched up to 54.9 while the Mid-American index tailed off to 55.5. The employment component of Minnesota’s index continued to run positive, topping 60 for the third month in a row. Manufacturing production in Minnesota is being boosted by a gradual rebound in international exports. Minnesota exports were 5 percent higher than a year earlier during the first quarter of 2017. This is the first quarterly growth for state exports since late 2014. Worldwide economic expansion is picking up after slowing during the past two years.
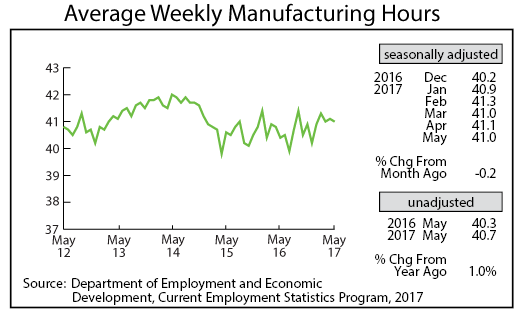
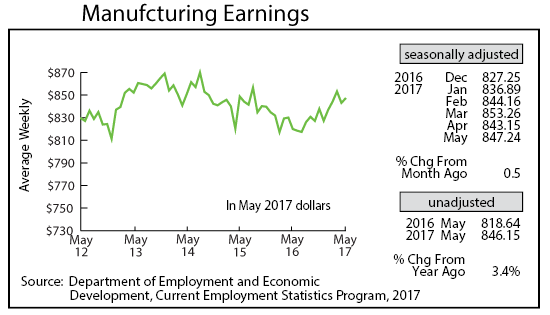
Adjusted Manufacturing Hours edged down slightly in May to 41.0. Factory hours have now averaged 41 hours or more per week for four months in a row. The last time this happened was late 2014. Average weekly Manufacturing Earnings climbed to $847.19 in May and have now been higher than a year ago in real terms for the last five months after having been lower than the prior year in both 2015 and 2016.
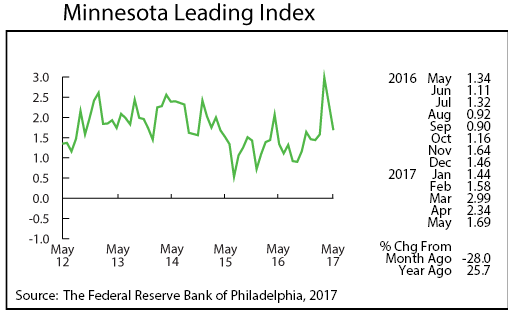
After reaching a seven-year high in March the Minnesota Leading Index slipped for the second straight month to 1.69. May’s reading still indicates that Minnesota’s economy will continue to grow at a healthy rate through the rest of the year. The leading index has averaged 1.5 since 1982, so the 1.69 reading suggests near term growth will be slightly above the historical norm.
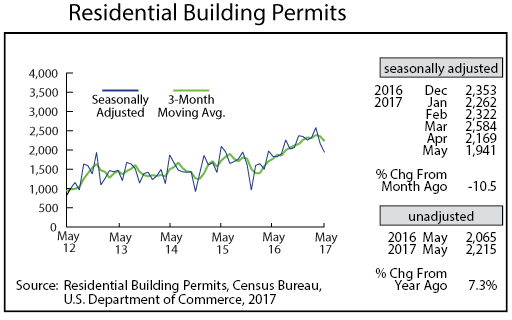
Adjusted Residential Building Permits declined significantly for the second month in a row, falling below 2,000 for the first time since last August. The building permit decline may just be payback for the high levels earlier in the year.
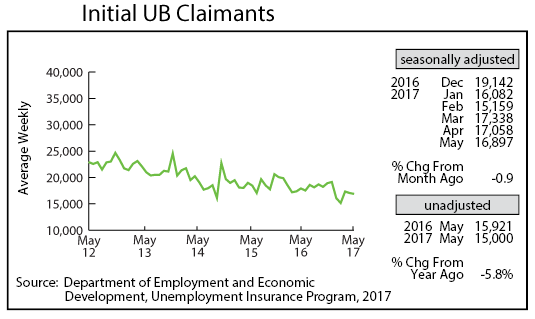
Adjusted Initial Claims for Unemployment Benefits (UB) inched down for the second straight month to 16,897. Initial claims levels remain near record-low levels, indicating that layoff activity remains subdued in Minnesota. Job growth will remain solid as long as the layoff rate continues to be low.
