by Nick Dobbins
February 2020
Monthly analysis is based on seasonally adjusted employment data. Yearly analysis is based on unadjusted employment data.*
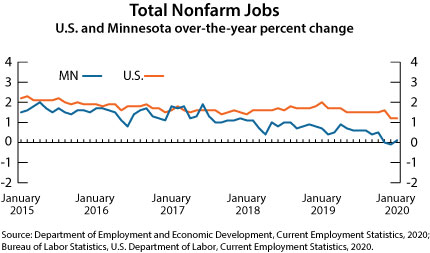
The Minneapolis-St. Paul-Bloomington MSA lost 31,975 jobs (1.6 percent) in January, slightly more than the statewide decline of 1.5 percent. Job losses of this magnitude, and even larger losses, are common for the month as post-holiday employment slumps tend to drive the change. Mining, Logging, and Construction employment was off by 4,654 (5.8 percent). Trade, Transportation, and Utilities lost 11,919 jobs (3.3 percent) as Retail Trade employment was off by 7856 (4 percent), and Transportation, Warehousing, and Utilities was off by 3,674 (4.6 percent). Every supersector in the area lost jobs on the month. Over the year the metro area added 1,569 jobs (0.1 percent), which matched the state's 0.1 percent annual growth. While small, the increase also pulled the MSA out of its brief dip into the red, as employment was down by 0.1 percent in December. Employment was up in eight of 10 published supersectors, with the largest numerical increase coming in Professional and Business Services (up 2,160 or 0.7 percent) and the largest proportional growth in Mining, Logging, and Construction (up 1.8 percent or 1,380 jobs). The largest counterweight to the MSA's employment growth came in Trade, Transportation, and Utilities, which lost 4,741 jobs or 1.3 percent, the largest real and proportional decline in the area. Retail Trade spurred the losses in the supersector, as they shed 3,415 jobs or 1.8 percent.
The Duluth-Superior MSA lost 2,506 jobs (1.8 percent) in January. While growth in every MSA in the state was negative on the month, the Duluth area outpaced the state's 1.5 percent decline, and had the largest job loss of any MSA primarily in Minnesota. The shared MSA primarily in Fargo was off by 2.4 percent. The area saw negative growth in every published supersector save Professional and Business Services (up 184 or 2.4 percent). The largest declines came in Trade, Transportation, and Utilities (down 959 or 3.8 percent, with losses in every component sector) and Mining, Logging, and Construction (down 611 or 7.2 percent). Over the year the Duluth area lost 924 jobs (0.7 percent). This was the largest proportional decline of any MSA in Minnesota and tied with Rochester. Mining, Logging, and Construction employment was down by 736 (8.5 percent). Government employers shed 817 jobs (3.1 percent), with most of that loss coming at the Local Government level (off by 727 or 4.1 percent). The largest proportional increase came in Other Services, where employment was up by 3.3 percent (206 jobs).
The Rochester MSA lost 1,933 jobs (1.6 percent) in January. Mining, Logging, and Construction employment was down 371 (7.3 percent). Educational and Health Services employment was down by 1,001 (1.9 percent), and Government employment was down by 288 (2.1 percent). The only supersector in the area to add jobs over the month was Manufacturing, up by 177 or 1.6 percent. Over the year the Rochester MSA lost 847 jobs (0.7 percent), the worst proportional over-the-year job loss for an MSA in Minnesota and tied with Duluth-Superior. It marked the first time that the area dipped into negative annual job growth since March of 2014. Professional and Business Services lost 357 jobs (6.1 percent), and Educational and Health Services lost 854 (1.7 percent). Mining, Logging, and Construction employment was up by 442 or 10.3 percent, the largest proportional gain in any supersector, by a large margin.
The St. Cloud MSA lost 1,270 jobs (1.1 percent) in January. Mining, Logging, and Construction employment was off by 384 (5.8 percent), the largest real and proportional decline of any supersector in the MSA. Trade, Transportation, and Utilities lost 365 jobs (1.6 percent) with all three component sectors shedding employment. Government employers added 178 jobs (1.2 percent), with growth split between the State and Federal levels. On the year the area added 566 jobs (0.5 percent). Mining, Logging, and Construction added 493 jobs (8.6 percent), the largest real and proportional increase over that period.
The Mankato-North Mankato MSA lost 563 jobs (0.9 percent) in January. This was actually the strongest performance of any MSA in the state. Private sector employers lost 699 jobs (1.4 percent), but public sector employers added 136 (1.4 percent). The Mankato area also had the strongest over-the-year growth in the state, adding 1,204 jobs or 2.1 percent. Private sector employers added 1,204 jobs (2.5 percent), and public sector employment was completely flat.
The Fargo-Moorhead MSA lost 3,452 jobs (2.4 percent) in January. Mining, Logging, and Construction was down 790 (9 percent), and Government employment was down 1,026 (5 percent). Over the year the MSA added 1,628 jobs (1.2 percent). Professional and Business Services employment was up by 1,074 (7.9 percent), the largest real and proportional growth of any MSA in the area. Mining, Logging, and Construction was up by 582 (7.8 percent) on the year.
Employment in the Grand Forks-East Grand Forks MSA was off by 805 (1.4 percent) in January. Mining, Logging, and Construction was off by 7.6 percent (197 jobs). The only published supersector to gain jobs was Manufacturing (up by 14 or 0.3 percent). Over the year the MSA added 42 jobs (0.1 percent). Manufacturing drove the growth, adding 321 jobs (7.2 percent) on the year. Government employers added 169 jobs (1.2 percent). Trade, Transportation, and Utilities employment was off by 193 (1.8 percent).
