
by Dave Senf
June 2015
Minnesota's recovery is six years old, but there's still room for improvement in some areas of the economy.
Minnesota's labor market continued to strengthen over the last 12 months, with the economic expansion completing its sixth year. The recovery is now one year longer than the average of the 11 post-World War II expansions, but it has been uneven and remains incomplete in Minnesota and nationwide.
Total jobs, job vacancies, the unemployment rate and layoffs (as measured by new claims for unemployment benefits) have returned to pre-recession levels. Wage and income growth, though, has been modest, and broader measures of unemployment, including underemployment, are still above levels of six years ago.
As of April, employment in Minnesota was 2.6 percent higher than the pre-recession peak reached in February 2008. That gain is similar to the 2.7 percent employment increase achieved from February 2001 to February 2008, the previous peak-to-peak employment period (see Figure 1).
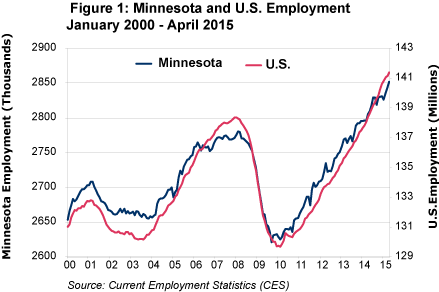
Both periods, about seven years long, produced unemployment rates around 3.7 percent. The major distinction between the two periods is obviously the depth and length of the two recessions that preceded them. The 2001 recession reduced Minnesota's employment by 2 percent, while the 2007-2009 recession cost the state 5.7 percent of its employment base.
The severity of the last recession and bumpy nature of employment growth since has left plenty of ground still to be covered, despite major indicators that are now at or above pre-recession levels. While unemployment has fallen across age, gender and racial groups, unemployment gaps for some groups remain substantial. And even though long-term unemployment and involuntary part-time employment have both fallen sharply, there is still a ways to go before full employment becomes a reality.
Real income growth remains lackluster as evidenced by real median household income, which is still below pre-recession levels, and by overall and child poverty rates that are above rates prior to the recession. While our national and state employment situation has improved significantly since entering the recovery in mid-2009, there remains much progress to make before we can say mission complete.
As of April, employment in Minnesota has expanded 8.8 percent since bottoming out in 2009. That is just short of the 9 percent national job rebound. Minnesota was the 15th state to recapture jobs lost during the recession, topping its pre-recession peak in September 2013 after losing 159,000 jobs, or 5.7 percent of the state's employment during the recession. Employment nationally dropped 6.3 percent during the recession and didn't reach its pre-recession peak until April 2014.
The state's job recovery was initially stronger than the national job rebound in 2010 and 2011. It then mirrored the national pace over 2012 and 2013 before falling significantly behind national growth in 2014. Figure 1 shows job growth for Minnesota and the U.S. since 2001. Minnesota's initial advantage in job growth after the recession was due to slightly faster private-sector job growth and a significantly smaller drop in public-sector employment relative to the U.S. public sector following the recession.
Minnesota's private payroll growth began to lag slightly behind U.S. private payroll growth in early 2013 and continued to lag throughout 2014 before increasing slightly faster than U.S. growth during the first few months of 2015. Minnesota cut public-sector jobs slower than the rest of the U.S. during the first few years after the recession. The state then started adding public workers in 2013 while public jobs were still being reduced nationally. Minnesota's public payroll has expanded at about the same pace as the U.S. since early 2014, when U.S. public payrolls starting inching up for the first time since 2008.
Private-sector employment is up 10.2 percent in Minnesota since the recession trough, while U.S. private-sector employment is 11.5 percent higher. Public-sector employment in Minnesota was 0.4 percent higher in April 2015 than in April 2008, while nationally public-sector employment was down 2.4 percent over the same period. The private-public split of employment in Minnesota in April was 85.3 percent private and 14.7 public. Nationally the split was 84.5 percent private and 15.5 percent public.
Table 1 compares Minnesota and U.S. job growth across sectors over the last 12 months (April 2014-2015). Job growth in the state during the last year slipped significantly behind the national pace, with only one sector (manufacturing) out of the 11 sectors adding jobs faster in Minnesota than nationally. Minnesota's hiring pace hasn't been this far off the national pace since 2007.
| Annual Employment Growth, April 2014 - April 2015 | ||
|---|---|---|
| - | Percent Change | |
| Minnesota | U.S. | |
| Total Nonfarm | 1.7 | 2.2 |
| Total Private | 2.1 | 2.6 |
| Goods-Producing excluding Agriculture | 2.6 | 2.5 |
| Private Service Providing | 2.0 | 2.6 |
| Mining and Logging | -0.9 | -3.0 |
| Construction | 5.0 | 5.0 |
| Manufacturing | 1.9 | 1.6 |
| Trade, Transportation and Utilities | 1.4 | 2.1 |
| Information | -0.1 | 2.2 |
| Financial Activities | 0.2 | 1.9 |
| Professional and Business Services | 3.5 | 3.6 |
| Educational and Health Services | 2.1 | 2.7 |
| Leisure and Hospitality | 3.0 | 3.1 |
| Other Services (Private Only) | 0.6 | 1.2 |
| Government | -0.7 | 0.3 |
| Source: Current Employment Statistics (CES), not seasonally adjusted | ||
Minnesota's wage and salary income, however, increased 5.6 percent between the fourth quarters of 2013 and 2014, compared with 5.1 percent growth nationwide. Minnesota's higher paycheck growth might be related to the state's tighter labor market, producing slightly faster wage growth than nationally, and a better mix of higher-paying new jobs. Personal income in the state rose 4.3 percent over the same period, while climbing 4.5 percent in the U.S. Minnesota's personal income growth was hurt by slower growth in transfer payments and by farm and non-farm proprietorship income.
The slowdown in Minnesota job growth over the last year was somewhat surprising because most labor market indicators remained positive. Initial claims for unemployment insurance benefits - a proxy for layoff levels - continued to remain low by historical standards, while job vacancies - a proxy for hiring demand - were 47 percent higher in the fourth quarter of 2014 than a year ago. Weekly work hours of private-sector workers were the highest reported since the series was initially reported in 2007. Manufacturing hours, available back to 1970, also set an annual average record high.
A record annual average was also reached by the Minnesota Business Conditions Index, which has been published since 1994. Various labor market indicators last year pointed toward Minnesota's job growth remaining robust. The unexpected slowdown might be related to Minnesota's tightening labor market. The pool of job seekers in Minnesota is significantly smaller than in many other states with higher unemployment rates. Minnesota's slower hiring pace last year might have been due more to slow labor force growth than waning labor demand.
Minnesota's employment expansion over the last 12 months was led by professional and business services, with 12,000 positions added. The educational and health services sector, as usual, was also busy hiring, boosting payrolls by 10,700 workers. Leisure and hospitality along with trade, transportation and utilities were two other top job generators, with 7,500 and 7,000 jobs added, respectively.
Most of the other jobs added were in manufacturing and construction, with 5,900 factory jobs and 4,800 construction jobs created. While both sectors have gradually added workers over the last five years, their workforces remain far below pre-recession levels. Three other sectors, as of April, are also still below pre-recession employment levels. Trade, transportation and utilities will probably regain all jobs lost during the recession this year. Complete recovery for the information and other services sectors will take longer.
While all regions in Minnesota have experienced job rebounds since the recession, the pace of the rebound has been slowest in Northeast and Southwest Minnesota. These two regions are the only parts of the state that have yet to completely recover jobs lost during the recession. Slower growth in these two regions is not unexpected, as they have the state's oldest workforces and slowest growing labor forces. Figure 2 compares wage and salary employment during the third quarter between 2006 and 2014 across regions, with regional employment totals normalized to third quarter 2007 employment levels.
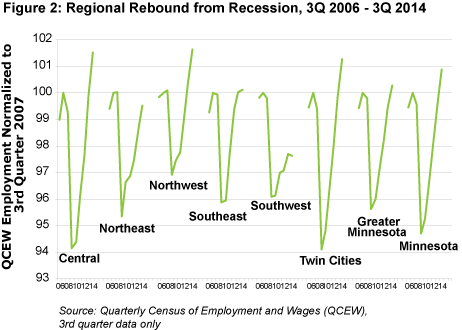
Northwest Minnesota was the least affected by the recession, losing only 3 percent of its employment, while Central Minnesota and the Twin Cities regions were the hardest hit areas, with job loss near 6 percent. Northwest and Southeast Minnesota were the first regions to recapture jobs lost during the recession, but job growth in Southeast was minimal last year. Job growth was strongest in the Central, Twin Cities, Northwest and Northeast regions last year. Southwest Minnesota, after four straight years of moderate job growth, saw jobs slip in 2014.
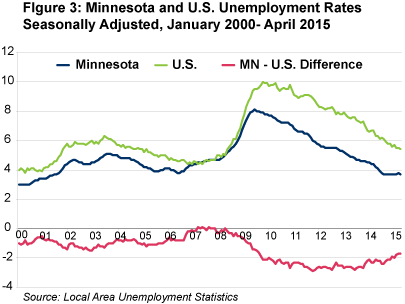
Minnesota's unemployment rate continues to be significantly lower than the national rate, but the difference has been steadily shrinking over the last year. Minnesota's rate leveled off during the past nine months, while the U.S. rate continued to decline. April's unemployment rate in Minnesota was 3.7 percent compared with the national rate of 5.4 percent. The 1.7 percentage point difference is rapidly closing in on the 39-year average difference of 1.5 percentage points. During the recession Minnesota peaked at 8.2 percent (seasonally adjusted), while the U.S. rate continued to increase until peaking at 10 percent in early 2010.
Minnesota's unemployment rate dropped faster than the country's after the recession, with the state's job growth outpacing national growth in 2010 and 2011. As a result, Minnesota's unemployment rate remained 2 percentage points below the U.S. rate from late 2009 until just recently (see Figure 3).
As of April, Minnesota had the fifth-lowest unemployment rate among states. Before the recession, Minnesota's unemployment rate ranked in the middle of all states. That was high by Minnesota standards. The state on average has had the 12th-lowest unemployment rate since consistent state unemployment rates were first published in 1976.
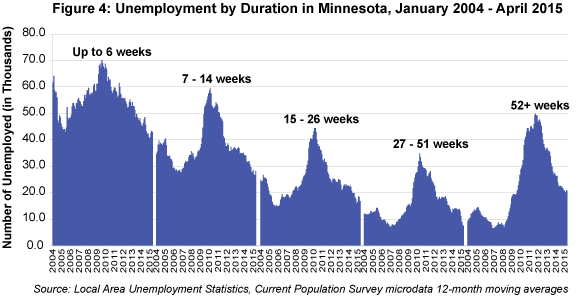
While Minnesota's overall unemployment rate has flattened out, the broader unemployment picture continued to improve last year. Between April 2010 and June 2013, the number of long-term unemployed - longer than 27 weeks - was the largest share of all unemployed. But long-term unemployment numbers have been steadily dropping since 2010. Long-term unemployment declined from 38,000 a year ago to 28,000 in April. Minnesota's long-term unemployed accounted for 24 percent of all unemployed in the latest report, compared with 32 percent nationally.
All durations of unemployment are now near or below pre-recession levels except for workers unemployed 52 weeks or more (see Figure 4). The number of workers unemployed 52 weeks or more is still twice the level prior to the recession.
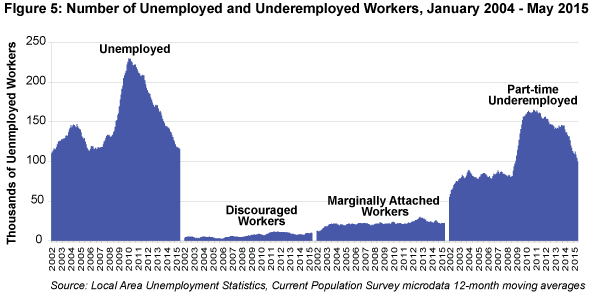
Part of the decline in unemployed workers can be attributed to people dropping out of the workforce. While the 3.7 percent unemployment rate is the lowest since late 2001 and sustainably lower than the state's 39-year average of 5.8 percent, broader measures of unemployment are still higher than before the recession. Broader measures of unemployment include discouraged workers (U-4), marginally attached workers (U-5) and marginally attached workers plus part-time workers who want to work full time but can't find a full-time job (U-6).
Discouraged workers are people who are not in the labor force but are available for work. They have looked for a job sometime during the prior 12 months but not in the last four weeks because they don't believe they can find work.
Marginally attached workers include discouraged workers and people who are also not in the labor force. They are available for work and have looked for work sometime during the prior 12 months but not in the last four weeks for reasons other than believing that no jobs are available.
People employed part time for economic reasons are those working fewer than 35 hours per week who want to work full time, are available to do so, but can't find a full-time job.
All of the broader measures of unemployed have declined over the last few years, but they are still above levels prior to the recession (see Figure 5). Part-time underemployed numbers have improved the most over the last few years. Minnesota's broadest measure of unemployed - the U-6 rate, which adds part-time underemployed workers - peaked at 14.2 percent and has declined to 8.4 percent as of first quarter 2015. The national U-6 rate peaked at 16.8 percent and has declined to 11.7 percent. Minnesota's U-6 has dropped 5.8 percentage points, while the U.S. decline stands at 5.1 since peaking during the worst of the recession. Minnesota had the eighth- lowest state U-6 unemployment rate as of the first quarter of this year. Despite some setbacks, Minnesota's unemployment picture has brightened over the past year.
Job vacancies, as estimated by DEED's Job Vacancy Survey (JVS), continued to climb last year, jumping 47 percent from the end of 2013 to the end of 2014. The 88,900 job vacancies reported during fourth quarter 2014 were 3.4 times higher than the 25,900 reported during the bottom of the recession in fourth quarter 2009.
Another job vacancy estimate, the Conference Board's monthly Help Wanted Online (HWOL), reports online ads during the first four months of 2015 running 15 percent higher than last year. Online help-wanted advertising in Minnesota as of April was 148 percent higher than the lowest level reached during the recession, according to HWOL. Online help-wanted ads nationwide have climbed 91 percent from the recessionary low point.
The ratio of unemployed people to vacancies in Minnesota fell to 1.1 in the fourth quarter of 2014, the second-lowest level on record, according to the JVS. The lowest ratio, 0.9, was recorded during the second quarter of 2001 at the end of the job expansion boom between 1992 and 2000. The ratio jumped to 2.6 by 2003, as the 2001 recession elevated layoffs and curbed job growth. The ratio reached its highest level in fourth quarter 2009, when there were 8.2 unemployed people for each vacancy.
The Conference Board publishes a similar ratio called the supply/demand rate. The rate nationally in April was 1.6, or 1.6 unemployed people for each online help-wanted ad. Minnesota's ratio was 0.8, the fifth lowest among states. Nine states have supply/demand rates below 1, with Nebraska and North Dakota having the lowest rates at 0.6. Iowa and South Dakota are also below 1, while Wisconsin's rate stands at 1.2. The low supply/demand rates are another indicator that Minnesota and neighboring states have tighter job markets than most other areas of the country.
While job openings have completely rebounded since the recession, the quality of job openings - in terms of hours and wage offers - are still below pre-recession levels. Job quality indicators showed mixed improvement last year. The percentage of openings that were part time tailed off slightly from the previous year, while real wage offers were up in the Twin Cities but flat across Greater Minnesota.
The only hours information collected in the JVS is the share of part-time versus full-time vacancies. The share of vacancies that were part time has ranged from 34 to 45 percent since 2001, averaging 39 percent. Before the Great Recession, the share of vacancies that were part time averaged 37.9 percent. The share of part-time vacancies increased during the recession, averaging 40.4 percent. Since then, part-time vacancies have remained high, averaging 40.8 percent of all vacancies. Part-time vacancies decreased last year, falling to 40.9 percent of vacancies from 42.1 percent in 2013. Full-time jobs continue to be more difficult to find post-recession when compared with 2001 through 2007.
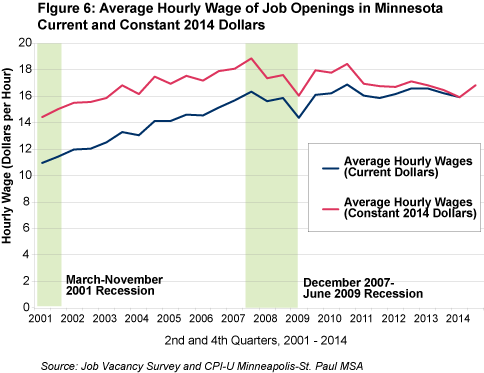
Average wage offers, both nominal (current dollars) and real (constant 2014 dollars), are another key measure of job quality. Statewide, both average nominal and real wage offers climbed steadily from 2001 to the start of the recession and then slipped throughout the recession.
Wages rebounded to near pre-recession highs shortly after the recession. They stumbled in 2011 and then leveled off until last year, when wage offers inched upward, as Figure 6 shows. Average real wage offers grew 11.8 percent between the fourth quarters of 2001 and 2014, or about 0.9 percent a year on average. Real wage offers increased 1.9 percent between the fourth quarters of 2013 and 2014, hopefully starting a trend of solid real wage gains. Despite the real gain in wage offers to $16.80 during fourth quarter last year, the average real wage offer is still 11 percent below the peak offer of $18.86 during fourth quarter 2007.
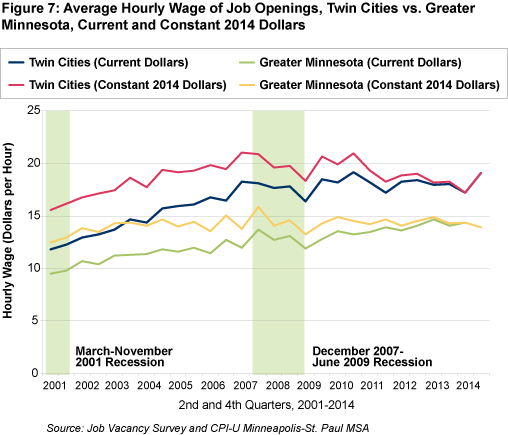
As shown in Figure 7, last year's real wage offer increase was confined to the seven-county Twin Cities, as wage offers in Greater Minnesota were essentially unchanged in 2014. Average wage offers in Greater Minnesota have remained consistently below those of the Twin Cities, ranging from 17 to 43 percent below Twin Cities wage offers between 2001 and 2014. In fourth quarter 2014, the average wage offer in Greater Minnesota was $13.93, compared with $19.11 in the Twin Cities, or 27 percent lower.
One of the most important determinants of the wage offered for a job opening is the education background required to fill the job vacancy. The share of job openings requiring no education has increased over the last two years, while the share of openings requiring post-secondary education has dropped, as shown in Figure 8.
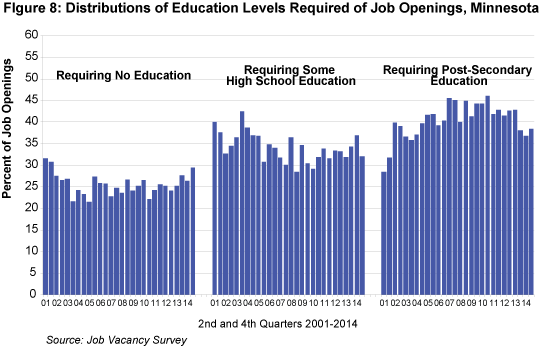
These two trends might be the product of a tightening job market. As jobs become easier to find, turnover rates increase, especially for low-wage jobs, as workers job hop for higher pay. Higher turnover creates more openings, leading to a larger share of job vacancies requiring no education.
A tighter job market also makes it harder for employers to demand higher educational requirements of job seekers since the pool of unemployed with higher educational backgrounds has shrunk. The declining share of job vacancies requiring post-secondary education might be another indicator that Minnesota's job market has shifted from a buyer (employers) job market to a seller (employees) job market.
Minnesota's job growth is off to a solid start in 2015, averaging 1.6 percent on a year-over-year basis. That is roughly in line with the 1.5 percent job growth expected for all of 2015. After tailing off last year to 1.3 percent, job growth is expected to experience a modest uptick this year. Job expansion will be just a tad below the 1.6 average annual rate achieved since 2011. Overall, the Minnesota economy is forecasted to generate 40,600 wage and salary jobs in 2015, up modestly from the 37,200 added last year.
Labor market indicators remain positive early in 2015, pointing toward another year of steady employment expansion. Job vacancies continue to remain well above pre-recession levels, while initial claims for unemployment are at a 14-year low.
All sectors except mining and information will expand payroll numbers in 2015, producing the fifth year of solid employment expansion. This is Minnesota's best four-year period of job growth since 1996-2000. Annual job growth during the booming 1996-2000 period averaged 2.4 percent, compared with 1.6 percent achieved over the last four years.
Construction employment is expected to increase strongly for the third straight year as the lackluster home-building rebound picks up speed. Manufacturing hiring is expected to remain solid for the second straight year despite the strong dollar headwind. Professional and business services, educational and health services, and leisure and hospitality are all expected to add slightly more jobs this year than in 2014. Payroll growth in the public sector will slip from last year's pace, but job growth in other services will be positive for the first time in three years.
Trade, transportation and utilities jobs will grow at the same rate as last year, pushing this sector's annual average job total above its 2008 total. Financial activities employment, after almost no growth last year, will see more hiring, but the rate will be well below the historical pace. Employment in construction, manufacturing, information and other services will remain below pre-recession levels.
Minnesota's unemployment rate has been stuck at 3.7 percent for almost a year now, in contrast to a national rate that has been steadily declining. During the last 12 months, Minnesota's job growth has lagged significantly below the U.S. pace for the first extended period since the job recovery began. Minnesota's tighter job market has likely contributed to the state's slower job growth, as qualified job seekers have become harder to find.
Slower job growth, however, is not the only reason for Minnesota's flat unemployment rate. The state's labor force participation rate, which had been sliding along with the U.S. rate over most of the last five years, has been inching upward over the last six months and is now at its highest level in four years. The national rate has also stopped falling, flattening out over the same period. The net result is Minnesota's labor force has been growing significantly faster than the country over the last 12 months.
Improving labor market conditions in the state have finally drawn some of the state's discouraged and marginally attached workers back into the labor force. This is one key development that has been missing in the road to complete recovery.