by Nick Dobbins
March 2018
Monthly analysis is based on unadjusted employment data.
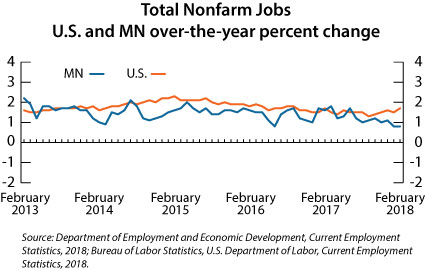
Employment in the Minneapolis-St Paul MSA was up by 3,227 (0.2 percent) in February. Educational and Health Services added 3,991 (1.2 percent), with gains in both component sectors. Leisure and Hospitality added 2,283 (1.3 percent), and Government employers added 3,076 (1.2 percent). On the other side of the ledger Trade, Transportation, and Utilities lost 2,877 jobs (0.8 percent), with losses in two of the three components (Retail Trade and Transportation, Warehousing, and Utilities). Professional and Business Services lost 2,438 (0.8 percent), with all of that decline coming in Administrative and Support and Waste Management and Remediation Services (off 2,885 or 2.8 percent). Over the year the metro area added 14,715 jobs (0.8 percent). Over-the-year change mirrored over-the-month change in many supersectors, as growth occurred in Educational and Health Services (up 6,466 or 2 percent), Leisure and Hospitality (up 1,034 or 0.6 percent), and Government (up 6,086, 2.4 percent), while losses came in Professional and Business Services (down 4,060 or 1.3 percent), Manufacturing (down 531 or 0.3 percent), and Information (down 898, 2.4 percent). One series of divergence was Trade, Transportation, and Utilities, which was off in February but up by 3,232 (0.9 percent) on the year.
The Duluth-Superior MSA added 1,374 jobs (1 percent) in February. That 1 percent marked the highest over-the-month growth of any MSA in the state. The only two supersectors to lose jobs were Trade, Transportation, and Utilities (down 276 or 1.1 percent) and Information (down 11, 0.8 percent). Government employers led the way with 767 more jobs (2.8 percent) and were joined by Manufacturing (up 119 or 1.6 percent) and Educational and Health Services (up 483, 1.5 percent), among others. Annually the Duluth area added 1,690 jobs (1.3 percent). Mining, Logging, and Construction had the biggest over-the-year growth, up 7.1 percent (553 jobs) over February 2017. Other notable gains came in Educational and Health Services (up 531 or 1.6 percent) and Manufacturing (up 153, 2.1 percent). The Information supersector had the largest total and proportional job losses on the year, off by 75 jobs or 5.4 percent.
The Rochester area added 164 jobs (0.1 percent) in February. It was the lowest over-the-month growth rate of any MSA in Minnesota. This low growth is in part because Rochester was the only MSA in the state to show negative growth in the large Educational and Health Services supersector (down 105 or 0.2 percent). However, that decline was countered by growth in other areas, including Mining, Logging, and Construction (up 163 jobs or 4.2 percent), Manufacturing (up 75 or 0.7 percent), and Leisure and Hospitality (up 55, 0.5 percent). Over the year Rochester has added 165 jobs (0.1 percent). Leisure and Hospitality employers added 479 jobs (4.8 percent), leading the way in both actual and proportional job growth. Government employers added 305 jobs (2.4 percent), and Mining, Logging, and Construction added 109 (2.8 percent). Educational and Health Services led all supersectors in negative growth, off by 855 jobs or 1.7 percent.
The Saint Cloud MSA added 819 jobs (0.8 percent) in February. Its state-worst 2.7 percent January decline was also revised upward and is now only a 2.3 percent decline. February’s increase was spread among supersectors. Professional and Business Services added 201 (2.3 percent), and Educational and Health Services added 414 (1.9 percent). Trade, Transportation, and Utilities was the most prominent job shedder, off 232 (1.1 percent). The next largest total job loss came in Leisure and Hospitality, down 16 (0.2 percent). Annually the Saint Cloud MSA added 836 jobs (0.8 percent). All supersectors that gained jobs on the month also did so annually and vice-versa. Trade, Transportation, and Utilities lost 636 jobs (2.9 percent), with nearly all of those losses coming in Retail Trade (off 747, 2.5 percent), while Leisure and Hospitality lost 316 jobs (3.6 percent). Manufacturing added 473 jobs (3.2 jobs).
The Mankato-North Mankato MSA added 576 jobs (1 percent) in February, matching Duluth for the highest over-the-month growth in the state. Service providers drove the expansion, adding 569 jobs (1.2 percent) while goods producers added 7 jobs (0.1 percent). No published industry group lost jobs on the month. Mankato also had the highest over-the-year growth, up 2.9 percent (1,641 jobs). Private sector employers added 1,483 jobs (3.1 percent) while the public sector added 158 (1.6 percent).
The Fargo-Moorhead MSA added 1,218 jobs (0.9 percent) in February, most of them among service providers (up 1,186 or 1 percent). Government employers added 712 jobs (3.7 percent), and Educational and Health Services added 373 (1.5 percent). Professional and Business Services was the only supersector to lose jobs, off 243 (1.6 percent). Annually, the Fargo-Moorhead MSA added 288 jobs (0.2 percent). Goods producers added 357 percent (2.1 percent) while service providers lost 69 (0.1 percent). The largest job addition came in Educational and Health Services, which added 770 jobs (3.3 percent).
The Grand Forks-East Grand Forks MSA added 261 jobs (0.5 percent) in February. However, the largest proportional move was a decline in Mining, Logging, and Construction, which was down by 1.7 percent on the month (43 jobs). Annually the MSA lost 661 jobs (1.2 percent). It was the only MSA on this list with negative over-the-year job growth. A large drop in Leisure and Hospitality employment spurred the decline, as the supersector was off by 769 jobs or 12.3 percent on the year.
