by Cameron Macht
July 2017

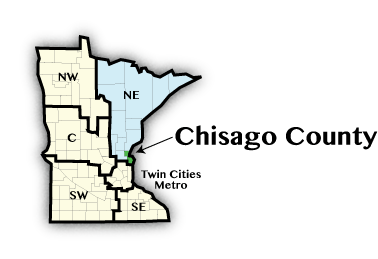
Chisago County was established in 1851, seven years before Minnesota became a state. The county's name comes from the Chippewa word – Ki-Chi-Saga – meaning "Fair and Lovely Lakes." Farming was originally one of the most important industries in the county, but was eventually replaced by tourism "when vacationers discovered the county's bountiful lakes and rivers."1
Located just north of the Twin Cities metro area, Chisago County saw rapid population growth from 1990 to 2010 as thousands of young families moved into the area. However, over three-fourths of the county's resident workforce commutes out of the county for their jobs. Census data show that over 21,700 of the county's more than 28,500 workers were driving outside the county for work, primarily to Ramsey, Hennepin, Washington, and Anoka Counties. While Chisago County had among the five highest foreclosure rates in the state from 2010 to 2013 during the Great Recession, it dropped back to the ninth highest rate by 2016, falling below pre-recession rates.
Health Care and Social Assistance is the largest employing industry in Chisago County, with 3,695 jobs at 86 establishments. The next largest industry is Manufacturing, with 2,413 jobs at 91 firms, accounting for 15.8 percent of total employment in the county. The two employing manufacturing specialties with the most employment are Transportation Equipment Manufacturing with 565 jobs and Plastics and Rubber Product Manufacturing with 530 jobs. Transportation Equipment Manufacturing has a location quotient of 9.4, meaning it is nearly 10 times more concentrated in the county than the rest of the state, while Plastics and Rubber Product Manufacturing has a location quotient of 6.3.
| Economy | ||
|---|---|---|
| 2016 Estimates | Chisago County | Minnesota |
| Population | 54,748 | 5,519,952 |
| Labor Force | 28,858 | 3,003,576 |
| Average Unemployment | 4.4% | 3.9% |
| Average Annual Income (2015) | $79,535 | $80,444 |
| Cost of Living, Individual | $33,996 | $29,856 |
| Cost of Living, Average Family | $61,396 | $55,200 |
| Source: U.S. Census Bureau, DEED Local Area Unemployment Statistics, American Community Survey, DEED Cost of Living Survey | ||
| Industry | ||||
|---|---|---|---|---|
| Top Industries of Employment | Total Employment 2016 | Percent Change 2006-2016 | Average Annual Wages | Percent Change 2006-2016 |
| Total, All Industries | 15,311 | 6.4% | $41,927 | 38.5% |
| Education and Health Services | 5,064 | 15.5% | $42,538 | 28.4% |
| Manufacturing | 2,413 | 17.2% | $48,054 | 47.6% |
| Trade, Transportation, and Utilities | 2,359 | 0.5% | $32,260 | 24.6% |
| Leisure and Hospitality | 1,650 | 3.6% | $14,027 | 53.3% |
| Source: DEED Quarterly Census of Employment and Wages, 2006-2016 | ||||
1"Chisago County History."

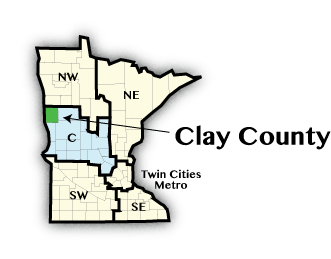
Originally called Breckenridge County, the name was changed to Clay County in 1862 when the county was officially formed. According to "Minnesota Place Names", Clay County was named in honor of Henry Clay, the greatly admired U.S. senator and statesman.2
Clay County forms the Minnesota side of the Fargo-Moorhead Metropolitan Statistical Area, which also includes Cass County, North Dakota. With 62,875 people in 2016, Clay was the 16th largest of the 87 counties in the state of Minnesota. Clay County's population more than doubled since 1950 and gained more than 11,500 people in just the past 15 years. Growth is expected to slow in the next 15 years, however, with the State Demographic Center projecting a population of 67,623 in 2030.
With 6,678 jobs at 175 establishments, Education and Health Services provided well over one-third of total employment in the county in 2016. However, unlike most counties where Health Care and Social Assistance is much larger than Educational Services, Clay County has the highest concentration of employment in Educational Services of any county in the state at 19.2 percent. The county had 3,575 jobs at Elementary and Secondary Schools and Colleges, Universities, and Professional Schools compared to 3,103 jobs in Health Care and Social Assistance.
| Economy | |||||
|---|---|---|---|---|---|
| 2016 Estimates | Clay County | Minnesota | |||
| Population | 62,875 | 5,519,952 | |||
| Labor Force | 35,544 | 3,003,576 | |||
| Average Unemployment | 3.5% | 3.9% | |||
| Average Annual Income (2015) | $67,563 | $80,444 | |||
| Cost of Living, Individual | $26,008 | $29,856 | |||
| Cost of Living, Average Family | $45,950 | $55,200 | |||
| Source: U.S. Census Bureau, DEED Local Area Unemployment Statistics, American Community Survey, DEED Cost of Living Survey | |||||
| Industry | ||||||
|---|---|---|---|---|---|---|
| Top Industries of Employment | Total Employment, 2016 | Percent Change 2006-2016 | Average Annual Wages | |||
| Total, All Industries | 18,652 | 6.7% | $38,052 | |||
| Education and Health Services | 6,678 | 7.0% | $38,237 | |||
| Trade, Transportation, and Utilities | 4,287 | 17.8% | $35,101 | |||
| Leisure and Hospitality | 1,921 | -6.7% | $16,406 | |||
| Professional and Technical Services | 1,211 | 48.2% | $56,880 | |||
| Public Administration | 1,137 | 9.9% | $47,747 | |||
| Source: DEED Quarterly Census of Employment and Wages, 2006-2016 | ||||||
2Upham, Warren. "Minnesota Place Names. A Geographical Encyclopedia." Minnesota Historical Society. St. Paul, MN. 1920.

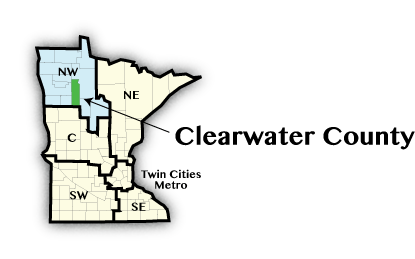
One of the last counties officially established in the state, Clearwater County's "topography is unique, with the northern part being drained through the Clearwater River and eventually the waters going to Hudson Bay, while the southern part has its drainage into the Mississippi River and then to the Gulf of Mexico." To that end, Clearwater County is perhaps most famous as home to Itasca State Park and Lake Itasca, the headwaters of the mighty Mississippi River.3
Clearwater County has recorded the highest average annual unemployment rate of the 87 counties in the state every year since 2000, ending 2016 at 9.6 percent, nearly 1.0 percent higher than the next highest rate. Clearwater County's unemployment rate peaked at 14.7 percent in 2009, and remained above 10 percent in 12 of the past 16 years. Even with high unemployment, Clearwater County's labor force continued expanding, adding over 300 new workers since 2001, a 7 percent increase.
Despite the high unemployment rates indicating a struggling economy, Clearwater County actually experienced the fastest employment growth of the 87 counties in Minnesota over the past 10 years. After adding 460 net new jobs, Clearwater County outpaced every other county with a 20 percent jump. Construction employment in the county doubled since 2006, building up payrolls by 149 jobs and quickly becoming the highest paying industry in the county, while Education and Health Services remained the largest industry after gaining 142 jobs. Manufacturing and Trade, Transportation, and Utilities also saw steady growth in the county over the past decade.
| Economy | ||
|---|---|---|
| 2016 Estimates | Clearwater County | Minnesota |
| Population | 8,827 | 5,519,952 |
| Labor Force | 4,697 | 3,003,576 |
| Average Unemployment | 9.6% | 3.9% |
| Average Annual Income (2015) | $56,984 | $80,444 |
| Cost of Living, Individual | $26,901 | $29,856 |
| Cost of Living, Average Family | $46,290 | $55,200 |
| Source: U.S. Census Bureau, DEED Local Area Unemployment Statistics, American Community Survey, DEED Cost of Living Survey | ||
| Industry | ||||
|---|---|---|---|---|
| Top Industries of Employment | Total Employment 2016 | Percent Change 2006-2016 | Average Annual Wages | Percent Change 2006-2016 |
| Total, All Industries | 2,760 | 20.0% | $39,571 | 49.9% |
| Education and Health Services | 833 | 20.5% | $26,741 | 6.9% |
| Trade, Transportation, and Utilities | 493 | 13.1% | $43,460 | 110.8% |
| Manufacturing | 470 | 12.2% | $54,838 | 70.4% |
| Construction | 289 | 106.4% | $72,583 | 86.3% |
| Source: DEED Quarterly Census of Employment and Wages, 2006-2016 | ||||
3"Clearwater County History."

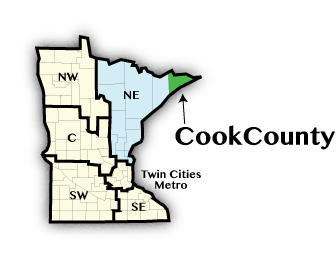
With 5,286 people, Cook County is now the sixth least populous county in Minnesota. It was the smallest as recently as 1990, but enjoyed a surge in population in the past 25 years. It is the only county in the state with only one city – Grand Marais -- which had about 20 percent of the county's population. The remaining residents live in the surrounding townships and unorganized territories stretching from Lake Superior to the Boundary Waters Canoe Area Wilderness to Minnesota's tallest mountain peaks and highest waterfall.
All of Cook County's population growth since 2000 occurred in the oldest age groups, making Cook County's population significantly older than the state's. Just under 45 percent of the county's residents were 55 years and over, compared to 26.8 percent statewide. In contrast, just 21.3 percent of the county's population was under 25 years of age, compared to 33 percent statewide. This has led to a declining labor force, with the county shedding just over 160 workers in the past 15 years and projected to lose over 100 more workers through 2030.
Cook County's economy is dependent on tourism with just over 40 percent of total employment in Leisure and Hospitality. That was the second highest share of Leisure and Hospitality employment in the state, behind only Mahnomen County. Cook County had more than 600 jobs in Accommodation, Including Hotels and Motels, Resorts, and Other Vacation Rentals, providing a huge and varied list of lodging options.4 The county also had 290 jobs at Food Services and Drinking Places, 185 jobs at the casino and casino hotel, and about 140 jobs at Other Amusement and Recreation Industries such as golf courses, skiing facilities, and other sports centers.
| Economy | ||
|---|---|---|
| 2016 Estimates | Cook County | Minnesota |
| Population | 5,286 | 5,519,952 |
| Labor Force | 3,056 | 3,003,576 |
| Average Unemployment | 4.6% | 3.9% |
| Average Annual Income (2015) | $66,240 | $80,444 |
| Cost of Living, Individual | $26,989 | $29,856 |
| Cost of Living, Average Family | $45,803 | $55,200 |
| Source: U.S. Census Bureau, DEED Local Area Unemployment Statistics, American Community Survey, DEED Cost of Living Survey | ||
| Industry | ||||
|---|---|---|---|---|
| Top Industries of Employment | Total Employment, 2016 | Percent Change 2006-2016 | Average Annual Wages | Percent Change 2006-2016 |
| Total, All Industries | 2,841 | 2.2% | $30,823 | 21.8% |
| Leisure and Hospitality | 1,158 | 1.8% | $21,902 | 23.8% |
| Trade, Transportation, and Utilities | 502 | 19.2% | $31,096 | 23.1% |
| Public Administration | 402 | -8.8% | $45,829 | 27.9% |
| Education and Health Services | 375 | 7.1% | $39,856 | 18.0% |
| Source: DEED Quarterly Census of Employment and Wages, 2006-2016 | ||||
4"Lodging in Cook County MN."