by Luke Greiner and Amanda O'Connell
September 2022
Editor's Note: This article is further documentation for an article published in the March 2018 issue of Review.
Statewide, there are about 471,000 foreign-born residents in Minnesota, accounting for about 8.2% of the total population. In the 23-county Southwest Minnesota planning area, an estimated 20,170 foreign-born residents live, roughly 5% of the total population in the region. However, the total immigrant population in Southwest grew 40% from 2010 to 2020, equaling an additional 5,729 residents.
As Southwest's foreign-born population increased, data show that immigrants from Asia, Africa, and Latin America increased at a pace that far exceeded statewide growth. Immigrants from Central and South America account for half of the immigrants in Southwest, and their population increased 27.4% over the past decade to more than 10,100 people. Numbering roughly 6,000, immigrants from Asia are the second largest group, accounting for 3-in-10 immigrants in Southwest Minnesota.
A smaller but faster growing group of immigrants were born in Africa, primarily Eastern Africa, accounting for just over 2,600 immigrants in the region. Foreign-born residents from Europe account for only 5.8% of the immigrants in Southwest, and the number of residents from this part of the world declined over the past decade by nearly 15% (see Table 1).
| Table 1. Place of Birth for the Foreign Born Population, 2020 | Southwest Minnesota | Change from 2010-2020 | Minnesota | Change from 2010-2020 | |||
|---|---|---|---|---|---|---|---|
| Number | Percent | Number | Percent | Number | Percent | ||
| Total, Foreign-born Population | 20,170 | 5.1% | 5,729 | 39.7% | 470,687 | 8.2% | 28.3% |
| Europe | 1,176 | 5.8% | -201 | -14.6% | 45,867 | 9.7% | 1.9% |
| Europe: - Northern Europe: | 207 | 17.6% | -172 | -45.4% | 8,417 | 18.4% | -6.1% |
| Europe: - Western Europe: | 392 | 33.3% | -152 | -27.9% | 10,255 | 22.4% | -2.8% |
| Europe: - Southern Europe: | 54 | 4.6% | 22 | 68.8% | 2,668 | 5.8% | 31.8% |
| Europe: - Eastern Europe: | 515 | 43.8% | 93 | 22.0% | 24,452 | 53.3% | 4.4% |
| Asia | 5,966 | 29.6% | 2,309 | 63.1% | 174,828 | 37.1% | 28.5% |
| Asia: - Eastern Asia: | 1,135 | 19.0% | 278 | 32.4% | 37,314 | 21.3% | 19.7% |
| Asia: - South Central Asia: | 838 | 14.0% | 280 | 50.2% | 43,371 | 24.8% | 51.2% |
| Asia: - Southeastern Asia: | 3,398 | 57.0% | 1,283 | 60.7% | 84,921 | 48.6% | 19.9% |
| Asia: - Western Asia: | 574 | 9.6% | 449 | 359.2% | 8,873 | 5.1% | 74.5% |
| Africa | 2,638 | 13.1% | 1,278 | 94.0% | 125,135 | 26.6% | 78.2% |
| Africa: - Eastern Africa: | 1,542 | 58.5% | 835 | 118.1% | 82,990 | 66.3% | 1.7% |
| Africa: - Middle Africa: | 6 | 0.2% | -6 | -50.0% | 3,848 | 3.1% | 177.6% |
| Africa: - Northern Africa: | 219 | 8.3% | -74 | -25.3% | 6,871 | 5.5% | 39.7% |
| Africa: - Southern Africa: | 53 | 2.0% | -19 | -26.4% | 1,693 | 1.4% | 80.7% |
| Africa: - Western Africa: | 620 | 23.5% | 450 | 264.7% | 26,735 | 21.4% | 56.9% |
| Oceania | 265 | 1.3% | 166 | 167.7% | 1,846 | 0.4% | 15.4% |
| Americas | 10,125 | 50.2% | 2,177 | 27.4% | 123,011 | 26.1% | 7.8% |
| Americas: - Latin America: | 9,797 | 96.8% | 2,302 | 30.7% | 111,190 | 90.4% | 9.6% |
| Latin America: - Central America: | 9,006 | 91.9% | 2,080 | 30.0% | 80,406 | 72.3% | 0.8% |
| Central America: - Mexico | 5,222 | 58.0% | 278 | 5.6% | 59,735 | 74.3% | -9.0% |
| Latin America: - South America: | 633 | 6.5% | 153 | 1.9% | 23,584 | 21.2% | 36.2% |
| Americas: - Northern America: | 328 | 3.2% | -125 | -27.6% | 11,821 | 9.6% | -6.3% |
| Source: U.S. Census Bureau, 2016-2020 American Community Survey | |||||||
Since the pandemic the rate of immigration into the area is less than half what it was in the prior decade, yet previously settled immigrants continue to grow families and increase the diversity in the region. Because their children are often born here in the U.S., immigrants are less likely to be very young (under 15 years of age), or because they have recently come here, are also much less likely to be older than 65 years. This contributes to a high labor force participation rate as few immigrants are too young to work or too old to have aged out of the labor force. Statewide, 72.2% of immigrants are in the labor force, and only 3.5% reported that they were unemployed.
Unfortunately, because of their small populations in many of the region's smallest counties we can't determine how many foreign-born workers are in the Southwest labor force, but we know that almost 95% of immigrants in the region are non-White, meaning they are represented in the racial labor force data that include both immigrants and non-immigrants of each major racial category.
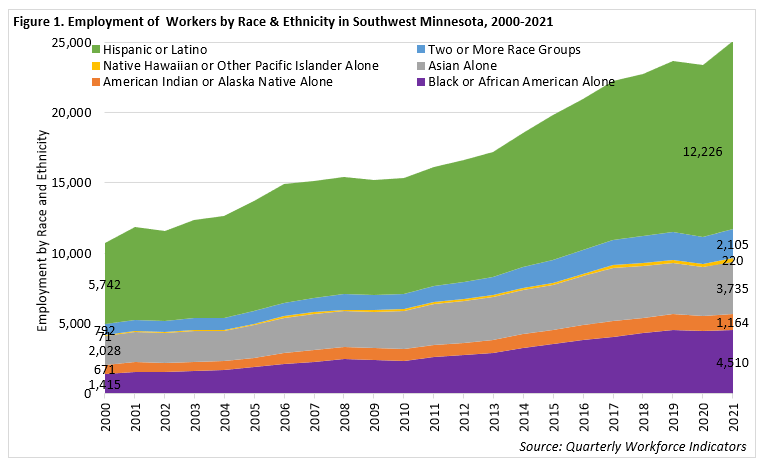
The increasing numbers of immigrants mean a growing number of jobs are held by workers of other races and ethnicities. While more than 86% of the jobs in Southwest Minnesota are filled by White workers, a growing number are held by minority workers, with the largest number being workers of Hispanic or Latino origin. Hispanic or Latino workers hold more than 13,360 jobs in the region, accounting for nearly 7.2% of total jobs, followed by Black or African Americans, who hold just less than 2.5% of jobs. While not all of these workers are immigrants, certainly many are immigrants or the second-generation offspring of immigrants (Figure 1).

Minnesota's Food Manufacturing industry has long been an important employer of immigrants. The industry provides many lower-skilled and non-English language proficient immigrants an entry point into the workforce, where value-added skills can be developed. Communities such as Worthington, Marshall, and St. James with large Food Manufacturing facilities tend to be significantly more racially diverse than surrounding communities because immigrants migrate to these hubs of employment opportunities. This segmented diversity can be stark considering that Food Manufacturing is the largest subsector in the region, with 11,748 jobs (38% of all Manufacturing jobs) in 2021. However, as immigrants acquire new skills and families grow, the surrounding communities often become the home of succeeding generations of immigrants as they disperse.
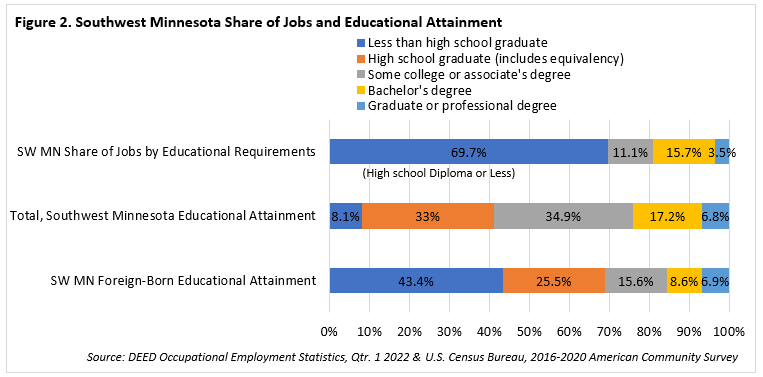
Immigrants have become vital for Southwest Minnesota's labor force, filling available jobs and enhancing regional growth. Educational attainment among immigrants complements the labor market demand in the region they reside in. According to data from DEED's Occupational Employment and Wage Statistics program, about 70% of jobs in Southwest Minnesota require a high school diploma or less (Figure 2); comparatively, 68.9% of immigrants in Southwest Minnesota hold less than a high school degree, allowing them to fill entry-level positions. In addition, about 15.6% of Southwest immigrants have attended some college or earned an Associate's degree, 8.6% hold a Bachelor's degree, and 6.9% hold a Graduate or professional degree, which aligns with regional needs (see Figure 2).

| Table 2. Citizenship Status for the Foreign Born Population in Southwest Minnesota, 2020 | ||
|---|---|---|
| - | Number | Percent |
| Total | 20,170 | 100% |
| Naturalized | 7,416 | 36.8% |
| Not a U.S. Citizen | 12,754 | 63.2% |
| Source: U.S. Census Bureau, 2016-2020 American Community Survey | ||
About 36.8% of immigrants in Southwest Minnesota are U.S. citizens by naturalization (see Table 2). This percentage is lower than the state of Minnesota (54.6%). In the Southwest Martin County has the highest rate of immigrants that are U.S. citizens by naturalization (82.3%). In contrast, Pipestone County (21.6%) has the lowest percentage of immigrants that are U.S. citizens by naturalization.
Immigrants might face barriers to employment in the region such as the lack of education or ability to speak English. Minnesota Adult Basic Education (ABE) provides people with educational opportunities to improve their skills to create opportunities for themselves that benefit their families and community. ABE programs offer people the ability to improve their reading, writing, mathematics, financial literacy, and critical thinking skills. Specifically, ABE offers programs such as English as a Second Language (ESL) and General Educational Development (GED) prep. These programs are available at little or no cost and can be beneficial to immigrant populations who want to increase their English skills and educational attainment.
| Table 3. Southwest Minnesota, Foreign-Born Population | ||
|---|---|---|
| Southwest Counties | Foreign-born Population | Percent of Total County Population |
| Nobles | 4,540 | 20.6% |
| Watonwan | 1,433 | 12.9% |
| Lyon | 1,889 | 7.5% |
| Cottonwood | 718 | 6.2% |
| Pipestone | 573 | 6.2% |
| Chippewa | 754 | 6.1% |
| Blue Earth | 3,615 | 5.2% |
| Sibley | 726 | 4.8% |
| Nicollet | 1,447 | 4.2% |
| Jackson | 370 | 3.7% |
| Murray | 257 | 3.2% |
| Waseca | 613 | 3.2% |
| Swift | 296 | 3.0% |
| Redwood | 381 | 2.5% |
| Brown | 632 | 2.4% |
| Rock | 233 | 2.4% |
| Lac qui Parle | 155 | 2.3% |
| Le Sueur | 632 | 2.2% |
| Yellow Medicine | 211 | 2.2% |
| Faribault | 274 | 2.0% |
| Martin | 305 | 1.5% |
| Big Stone | 58 | 1.1% |
| Lincoln | 58 | 1.0% |
| Source: U.S. Census Bureau, 2016-2020 American Community Survey | ||
In Southwest Minnesota three consortia provide ABE programs: Le Sueur, Mankato, and Marshall. From December 2021 to December 2022, the Marshall consortium has provided educational opportunities to 184 individuals totaling 11,816 hours of instruction. Of the 184 individuals, 59% participated in the ESL program. However, because of the pandemic, total ABE enrollment has decreased by 57% compared to pre-pandemic enrollment levels. To increase enrollment the Marshall consortium is set to implement virtual and hybrid classes.
The Southwest Minnesota counties with the highest population percentage being immigrants include Nobles County (20.6%) and Watonwan County (12.9%) (see Table 3). Not surprisingly, the Manufacturing industry has a significant presence in both Nobles and Watonwan County, creating employment opportunities for immigrants. In Nobles County 32% of the jobs are in the Manufacturing industry and 30% in Watonwan County.
Even with barriers to employment, immigrants in Southwest Minnesota help fill jobs. With the significant presence of the Manufacturing industry in Southwest Minnesota, immigrants migrate to these counties to find employment and contribute to the economy.