by Dave Senf
August 2018
Note: All data except for Minnesota’s PMI have been seasonally adjusted. See the feature article in the Minnesota Employment Review, May 2010, for more information on the Minnesota Index.
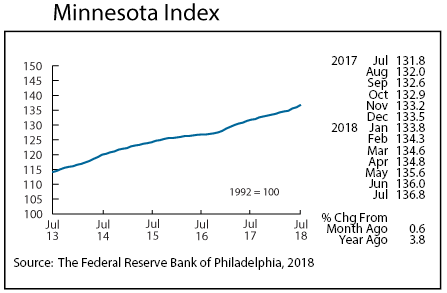
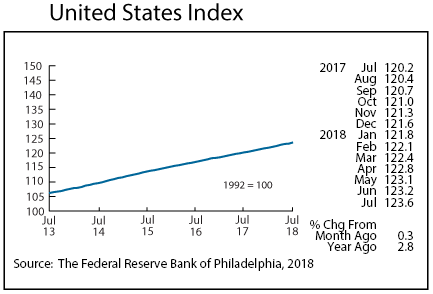
The Minnesota Index roared back in July, advancing 0.6 percent for the second time in three months. The acceleration in the index was fueled by another month of strong wage and salary employment growth and another drop in the unemployment rate. The index is designed to produce monthly estimates of how fast the state’s GDP is expanding.
Minnesota’s index outpaced the U.S. index, which increased 0.3 percent in July for the third straight month. Minnesota’s index was up 3.8 percent from a year ago while the U.S. index was 2.8 percent higher over the same period. Minnesota’s over-the-year increase has been higher than the U.S. for the last 17 months. Minnesota’s index has increased 5.2 percent during the last 17 months while the U.S. index advanced by 3.8 percent.
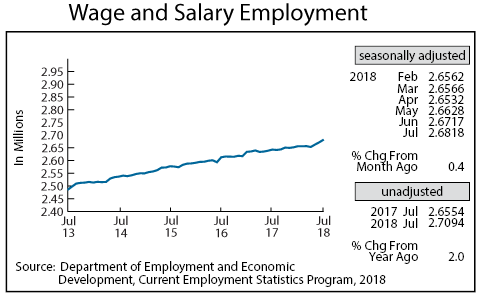
Minnesota’s adjusted Wage and Salary Employment recorded its third straight month of robust growth. Employers added 11,200 jobs in July as the private sector employers added 8,000 new workers while public sector payrolls expanded by 2,400. Private sector payroll numbers increased the most in Educational and Health Services, Trade, Transportation and Utilities, and Manufacturing. Eight of the 11 supersectors expanded their workforces in July. Manufacturing has added jobs every month this year. Employment in this sector is still short of pre-recession levels as July’s employment was 4.8 percent short of the pre-recession peak reached in February 2007.
Minnesota’s unadjusted over-the-year job growth spiked again in July to 2.0 percent, the highest over-the-year percent increase since April 2015. Minnesota’s over-the-year job growth was higher than the U.S.’s rate (1.7 percent) in July for the first time since June 2017.
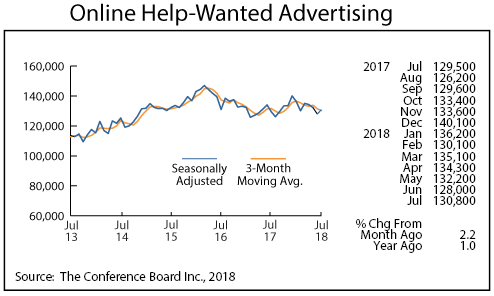
Online Help-Wanted Ads inched up in July to 130,800. Minnesota’s 2.2 percent increase was below the 3.8 percent gain nationally. The state’s unemployed workers-to-online help-wanted ads ratio in July, as reported by the Conference Board, was 0.71, second lowest to North Dakota’s 0.63. The ratio is now below 1.0 in 11 states including Iowa (0.77) and Wisconsin (0.91). Minnesota’s share of nationwide online help-wanted postings continues to run at 2.8 percent compared to the 2.0 percent share of national employment.
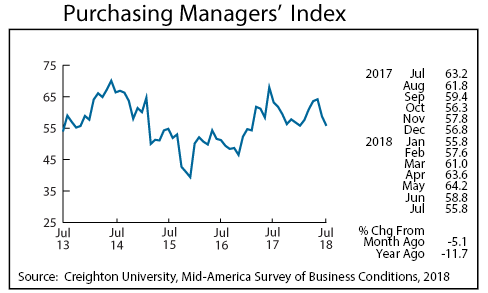
Minnesota’s Purchasing Managers’ Index (PMI) slipped for the second month in a row in July, falling to 55.1, the lowest reading since January. Minnesota’s PMI has averaged 54.1 since first being published in 1994, so the indicator is pointing towards faster than average long-term growth in Manufacturing over the next few months. Any reading above 50 signals that manufacturing activity is expected to advance over the next three to six months.
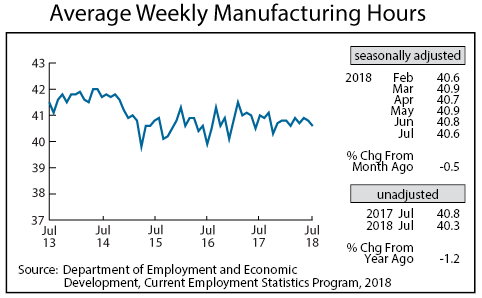
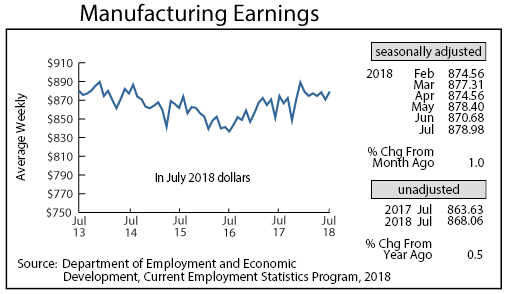
Adjusted average weekly Manufacturing Hours inched down for the second consecutive month, dipping to 40.6 hours. The factory workweek hasn’t been this low since February. Average weekly factory hours usually increase when manufacturing activity accelerates as employers add overtime. Average weekly Manufacturing Earnings, adjusted for inflation and seasonality, rose 1.0 percent in July to $878.98. Factory earnings, however, were only 0.5 percent higher than a year ago which is the smallest over-the-year real increase in manufacturing earnings since January 2017.
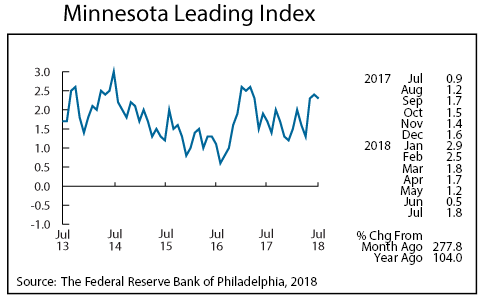
The Minnesota Leading Index dropped a notch to 2.3 in July but remained significantly elevated from the 1.5 average recorded over the last 36 years. Minnesota’s leading index was higher than the national leading index for the third consecutive month. This suggests that Minnesota’s economy will be expanding at a quicker rate than the U.S. economy over the next six months.
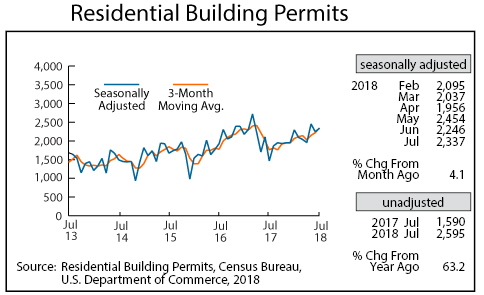
Adjusted Residential Building Permits climbed to 2,337 in July, the second highest monthly total of the year. Home-building permits have recovered over the last few months after a slow start at the beginning of the year. Home-building permits through July are 6.0 percent higher than the same period last year. July’s residential building permits accounted for 2.3 percent of the U.S. total. Minnesota has 1.7 percent of the nation’s population and 1.6 percent of nationwide residential building construction employment.
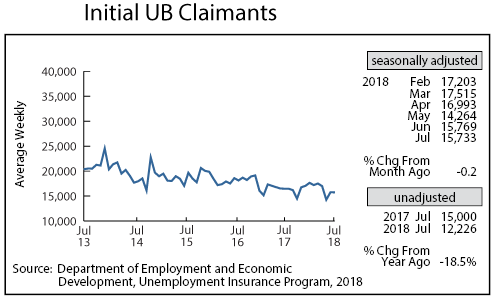
Adjusted Initial Claims for Unemployment Benefits (UB) hardly changed in July, coming in at 15,733 versus June’s 15,799. The level of initial claims in Minnesota, as is true nationally, has reached four-decade lows when viewed using the ratio of initial claims to employment. Minnesota’s job growth is likely to slow slightly from the fast pace of the last few months but will remain in the 1.5 percent neighborhood for the rest of the year given the low rate of workers filing initial claims for unemployment benefits.