by Mark Schultz
August 2018
By now it has become evident that the Southeast region is in the midst of a labor shortage with a current jobseeker per vacancy ratio of 0.6 to 1. For every 10 job openings there are only six unemployed people. In addition, labor force projections show that this current predicament is not going to get any better in the years to come and, in fact, may actually worsen as the labor force is projected to decrease by over 6,200 workers from 2020 to 2030. Many employers are well aware of this issue and have been pro-active in their efforts to hire and retain workers, including increasing wages, providing transportation to work, and offering more flexible scheduling just to name a few. And while increasing wages may be a step in the right direction, basic cost of living needs require even higher wages than employers may be able to offer and, when combined with occupations that are characterized by part-time hours, the double whammy of lower wages and fewer hours makes it difficult, if not relatively impossible, to afford the basic cost of living needs.
Depending on a variety of elements, including number of adults in the household, work status (i.e., full-time or part-time), and the presence of children, there is significant variation in the wages people need to earn in order to meet these basic cost of living needs. For example, while each parent in the average family in Minnesota – two parents, one working full-time and the other working part-time, with one child – needs to earn $16.17 per hour in order to cover these cost of living expenses, a single person with no children only needs to earn $13.80 while, if that single person had four children, the hourly wage needed would be a staggering $35.36 per hour. However, when there are two parents in the household, both working full-time and having one child, the hourly wage needed rests at a considerably lower $13.46 per hour (see Table 1).
| Table 1. Cost of Living Requirements, Southeast Minnesota | |||||||||
|---|---|---|---|---|---|---|---|---|---|
| Family Composition and Work Status | Family Yearly Cost of Living | Hourly Wage Required | Monthly Costs | ||||||
| Child Care | Food | Health Care | Housing | Transportation | Other | ||||
| Average Family - 2 Parent/1FT and 1PT/1Child | $50,460 | $16.17 | $333 | $752 | $417 | $850 | $825 | $468 | |
| Single/FT/No Child | $28,704 | $13.80 | $0 | $329 | $134 | $634 | $664 | $281 | |
| Single/FT/1 Child | $46,464 | $22.34 | $666 | $486 | $269 | $850 | $705 | $390 | |
| Single/FT/4 Children | $73,548 | $35.36 | $1,093 | $1,186 | $428 | $1,117 | $933 | $673 | |
| 2 Parents/2 FT/1 Child | $55,980 | $13.46 | $666 | $752 | $417 | $850 | $825 | $468 | |
| 2 Parents/2 FT/4 Children | $79,872 | $19.20 | $1,093 | $1,446 | $443 | $1,117 | $969 | $749 | |
| Source: DEED Cost of Living | |||||||||
Of the seven monthly costs included in DEED's cost of living data, housing and transportation are among the most expensive, while child care and food vary significantly depending on the family structure and work status – both child care and food increase drastically with the addition of children. In fact, when a single person or family has one child and is working full-time, child care jumps 100 percent compared to the cost for the average family. Note the assumption with the average family estimates is that the parent working part-time is caring for the children when not at work. When there is more than one child present, the cost of child care can jump by 228 percent.
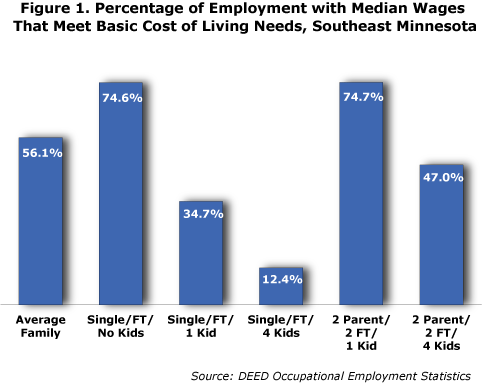
This begs the questions: How many occupations have median wages that meet specific cost of living needs and which occupational groups do they fall into? The answer isn't so straight forward depending on the family structure and work status of the adults. The percent of current employment that pays enough to meet these needs varies from a low of 12.4 percent of occupations earning median wages that are at or higher than those needed for a single person who is working full-time with four children to almost 75 percent for both a single person with no children and a two-parent family, both working full-time, with one child (see Figure 1).

For jobseekers, current job vacancy data show that nine of the 11 occupational groups with the highest number of vacancies are accompanied by median wage offers that are below the cost of living threshold for the average family in the region, while 12 of the total 22 occupational groups fit this criteria. In fact, the top three occupational groups with the highest vacancies, accounting for over one-third (37.7 percent) of the total job openings, have median wage offers below cost of living requirements for the average family. To further complicate things, many of these occupational groups whose vacancies have wage offers below cost of living requirements have much higher percentages of part-time openings, including 75 percent of the vacancies in food preparation and serving and over 60 percent for personal care and service, transportation and material moving, protective service, and installation, maintenance, and repair occupations. Of course, this also varies based on the family composition. For example, for a single person with no children who works full-time, only five of the occupational groups have vacancies with median wages that wouldn't allow them to afford the basic cost of living needs. In contrast, if that same single person had one child, the median wage offers for 18 of the occupational groups would not make the cut.
| Table 2. . Job Vacancy Characteristics, Southeast Minnesota, 4th Qtr. 2017 | |||||||||
|---|---|---|---|---|---|---|---|---|---|
| Occupational Group | Vacancies | Median Wage Offer | Percent Part-Time | ||||||
| Total, All Occupations | 10,820 | $14.01 | 40% | ||||||
| Top 11 | |||||||||
| Sales and Related | 1,552 | $14.33 | 28% | ||||||
| Food Preparation and Serving | 1,404 | $10.93 | 75% | ||||||
| Personal Care and Service | 1,118 | $11.49 | 67% | ||||||
| Healthcare Practitioners and Technical | 1,113 | $20.32 | 33% | ||||||
| Transportation and Material Moving | 912 | $14.93 | 64% | ||||||
| Building and Grounds Cleaning and Maintenance | 805 | $13.98 | 20% | ||||||
| Construction and Extraction | 774 | $17.72 | 0% | ||||||
| Production | 727 | $12.62 | 2% | ||||||
| Installation, Maintenance, and Repair | 501 | $13.97 | 61% | ||||||
| Healthcare Support | 394 | $12.98 | 57% | ||||||
| Office and Administrative Support | 364 | $14.59 | 33% | ||||||
| Bottom 11 | |||||||||
| Education, Training, and Library | 314 | $16.74 | 57% | ||||||
| Management | 149 | $32.99 | 1% | ||||||
| Computer and Mathematical | 116 | $21.09 | 3% | ||||||
| Farming, Fishing, and Forestry | 114 | $11.77 | 1% | ||||||
| Business and Financial Operations | 103 | $26.39 | 4% | ||||||
| Community and Social Service | 77 | $18.87 | 14% | ||||||
| Architecture and Engineering | 76 | $26.93 | 1% | ||||||
| Arts/Design/Entertainment/Sports/Media | 68 | $16.49 | 45% | ||||||
| Life, Physical, and Social Science | 65 | $23.41 | 3% | ||||||
| Protective Service | 34 | $14.89 | 64% | ||||||
| Legal | 26 | $15.20 | 0% | ||||||
| Source: DEED Job Vacancy Survey | |||||||||
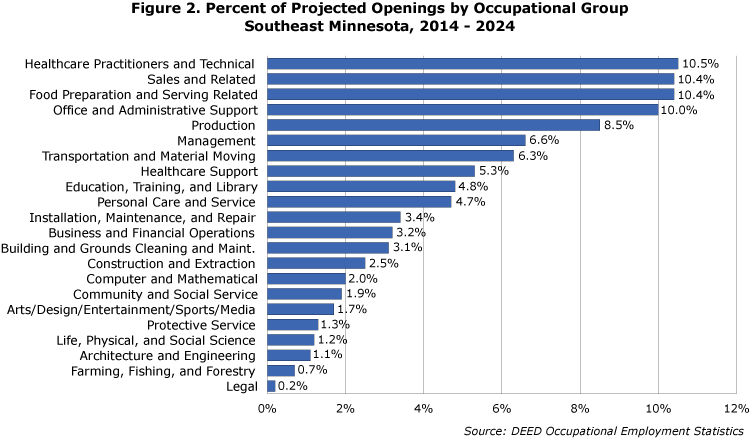
Projection data for the Southeast region show that there are projected to be 77,700 total openings from job creation and replacement needs for those who leave the workforce. On a bright note, healthcare practitioners and technical occupations are projected so see the highest number of total openings from 2014 to 2024, accounting for 10.5 percent of the total projected openings in the region. Traditionally, this is a higher paying occupational group and, at least based on current vacancy data above, currently has a median wage offer ($20.32) that is higher than that needed for the average family to meet the basic cost of living needs. Unfortunately, the remaining four of the top five occupational groups that are predicted to see the highest number of openings are in lower paying occupational groups which, again based on wage offers for current vacancies, may not meet the cost of living threshold. In all, these five occupations make up half of the projected job openings in the region, and the four lower paying groups comprise 39.3 of the total projected openings.

Because of the current labor force shortage some employers have been increasing starting wages to attract new talent, and, given the projected tightening of the labor force which is projected to lose over 6,200 participants through 2030, it can be assumed that wage hikes may continue. However, typically the cost of living also increases as time progresses so it may be true that median wage offers for vacancies in these low paying occupational groups may remain below what is needed to meet the basic cost of living needs. Thus, the region is facing a situation with a combination of factors that may hinder an individual's ability to cover cost of living needs based on the current employment and job openings, and also face a future in which residents may continue to feel this crunch.