Use the Jobs-Based Tool (Beta Version)
Use the Gross Regional Product-Based Tool (Beta Version)
 DEED’s target industry analysis tool allows you to explore industry specialization for Minnesota and its regions. Industry specialization is usually described in terms of location quotients (LQs), which measure the relative concentration of either jobs or gross regional product (GRP) in a regional industry compared to that industry nationally. You can view either a jobs-based version of DEED’s tool or a GRP-based version depending on whether you want to consider industries based on the number of people they employ or the dollar value of what they produce.
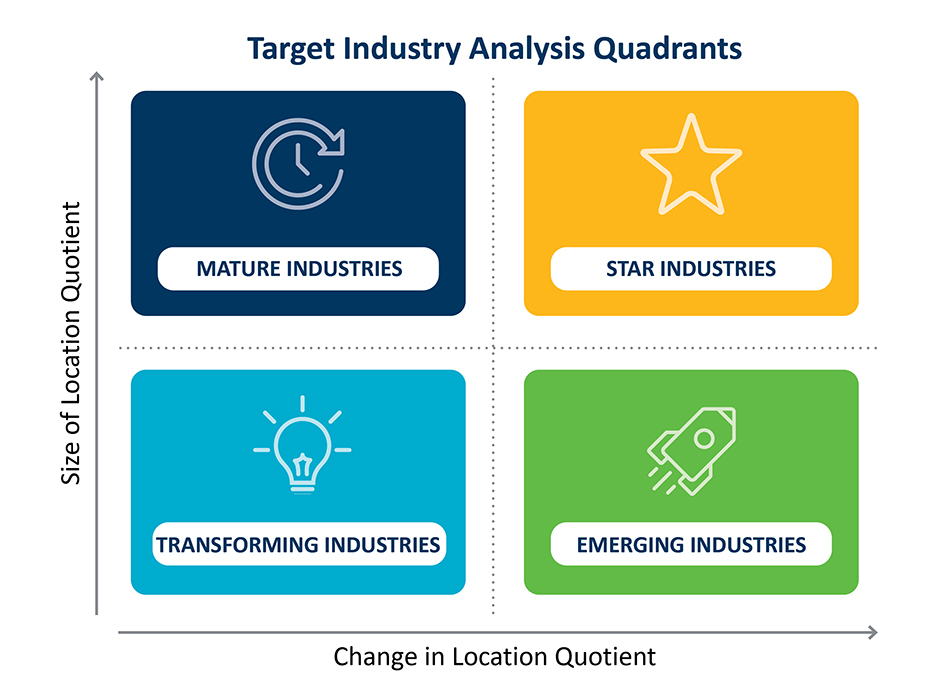
Based on LQs and how they change over time, we can group industries into categories to help prioritize them for economic development. Star and Mature industries both have a high degree of specialization (high LQs), but Star industries also display high growth in their LQ over a given time period, while Mature industries have little or negative growth. Emerging industries have a lower LQ but have displayed a growing concentration over time (high LQ growth), and Transforming industries have both low LQs and little or no LQ growth.
This tool gives you the ability to set both the LQ and LQ growth benchmarks, along with a variety of filters to refine which industries you want to examine. The benchmarks and filters will affect both the quadrant chart and the list of industries below it.
The tool also allows you to explore LQ data both for individual industries and for clusters of related industries. This can be helpful for comparing a cluster’s LQ data to that of its component industries.
This tool uses 2009-2019 jobs and GRP data to provide a retrospective, pre-pandemic analysis of Minnesota’s statewide and regional economies.
When LQ = 1, an industry has the same share of its regional jobs or GRP as it does in the nation. When LQ > 1, an industry has a greater share of the local area employment than it does nationwide.
This is a nominal (not percentage) change over time.
Defined as a regional concentration of related industries, the clusters in this analysis are taken from the U.S. Cluster Mapping project.
This analysis incorporates the U.S. Cluster Mapping project’s classification of clusters as either “traded” or “local.” Traded clusters are geographically concentrated and primarily export their products outside their region; local clusters are those commonly found across geographic areas and that sell their goods locally.
The regions in this analysis are defined at a county level. View the regions and their corresponding counties.
Economic data is from Emsi, an economic analysis tool that combines data from various federal sources including the Bureau of Labor Statistics, the U.S. Census and the Bureau of Economic Analysis.
Please email us at Economic.Development@state.mn.us with comments or questions about this tool.