by Dave Senf
August 2019
Note: All data except for Minnesota’s PMI have been seasonally adjusted. See the feature article in the Minnesota Employment Review, May 2010, for more information on the Minnesota Index.
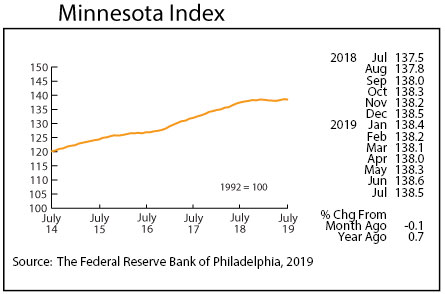
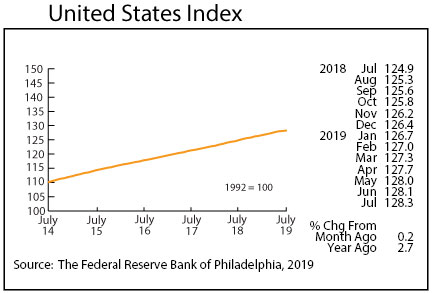
The Minnesota Index, after showing some signs of life during the previous two months, declined 0.1 percent to 138.5 in July. The index inched down as average weekly manufacturing hours dropped, wage and salary employment declined, and the state’s unemployment rate ticked up to 3.4 percent. The U.S. Index increased 0.2 percent in July after a 0.1 percent gain in June.
July’s reading was 0.7 percent higher than a year ago which is the lowest over-the-year gain since February 2010 when the state’s economy was just beginning to pick up from the Great Recession. The U.S. index was up 2.7 percent over the same period. Minnesota’s index has historically averaged 2.7 percent over-the-year compared to the 1.7 percent average through the first seven months of 2019. The state’s labor shortage is most likely restraining Minnesota’s economic growth rate, but the uptick in the state’s unemployment rate from 2.8 percent in October 2018 to 3.4 percent in July 2019 is inconsistent with the notion that employers can’t find anybody to fill their job vacancies.
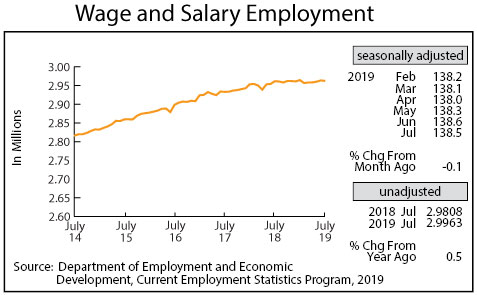
Adjusted Wage and Salary Employment declined in July by 1,300 jobs. Minnesota’s seasonally adjusted wage and salary employment was up only 1,300 through July. Minnesota added an average of 18,600 during the first seven months of the year between 2011 and 2018. Job growth was cut in half last year, falling from 1.3 percent in 2017 to 0.7 percent in 2018. It now appears that job growth might be cut in half again for the second year in a row, falling to around 0.3 percent on an average annual basis.
The private sector cut 1,700 jobs while the public sector added 400 jobs in July. Goods-producing employment increased for the fifth month in a row, expanding payrolls by 1,600, but service-providing employment slipped in July by 2,900 jobs on an over-the-year basis. Service-providing employment was down over the year for only the second time since 2010. Construction and Educational and Health Services added the most jobs while job cutbacks were highest in Leisure and Hospitality and in Other Services.
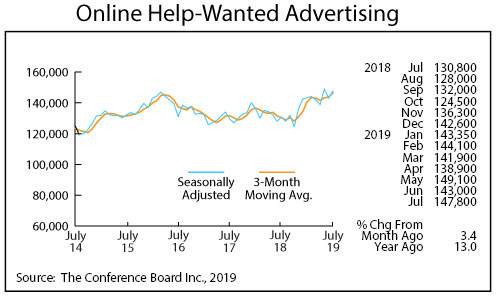
Help-Wanted Ads bounced back in July, increasing 3.4 percent to 147,800, the second highest total in the 14-year history of online help-wanted ads. Online job postings nationally decreased by 0.2 percent in July. Minnesota’s share of U.S. online help-wanted ads rose to 2.8 percent while its share of U.S. wage and salary employment remained at 2.0 percent. Labor demand in Minnesota, as measured by online help-wanted ads, continues to remain elevated even as the number of unemployed workers in the state increases.
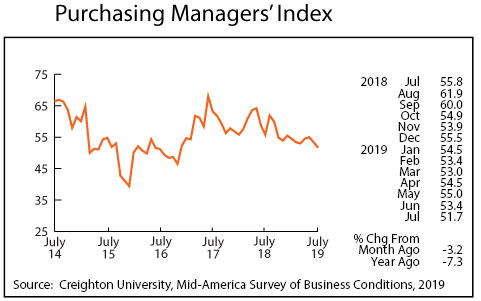
Minnesota’s Purchasing Managers’ Index (PMI) dipped for the second straight month to 51.7, the lowest reading in two and a half years. The other two comparable indices also slipped in July with the Mid-America Business Index tailing off to 52.0 and the Institute of Supply Management’s national PMI sliding to 51.2. Manufacturing activity has been slowing across the U.S. and Minnesota for almost a year now. Most analysts are blaming the ongoing trade wars for most of the manufacturing woes.
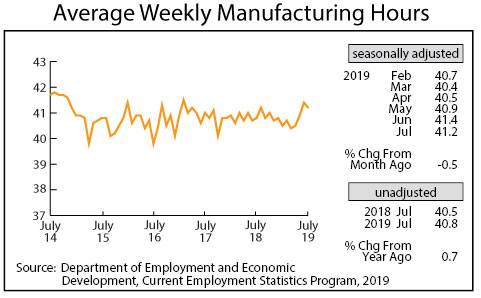
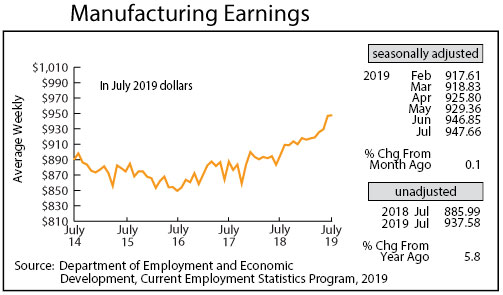
Adjusted average weekly Manufacturing Hours, after surging during the previous two months, slipped slightly in July to 41.2 hours. The recent uptick in factory workweek is inconsistent with a slowdown in manufacturing. Average weekly Manufacturing Earnings, adjusted for inflation and seasonality, rose for the sixth consecutive month to another all-time high of $947.66. Minnesota’s average weekly manufacturing earnings, after falling below the U.S. average over the last four years, has topped the U.S. average during the last three months.
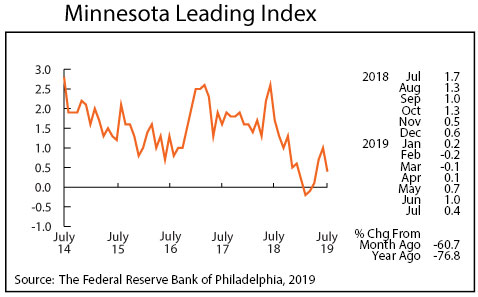
The Minnesota Leading Index, after climbing for three consecutive months, dropped in July to 0.4. The 37-year monthly average is 1.4, so the 0.4 reading suggests that Minnesota’s economic growth through the rest of the year will be significantly below the historical rate.
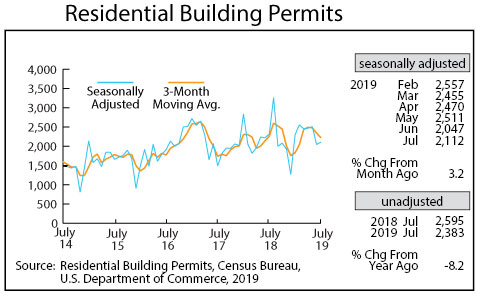
Residential Building Permits inched up in July to 2,112 which is exactly the monthly average for the 39-year data set. Minnesota home building permits accounted for 2.0 percent of all U.S. home building permits issued last year. Minnesota’s share of nationwide permits is up slightly to 2.2 percent over the first seven months of 2019.
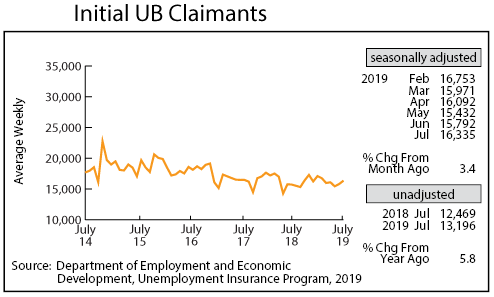
Adjusted Initial Claims for Unemployment Benefits (UB) inched up for the second month in July to 16,335. There is no sign of any recession on the horizon in recent initial claims levels. There has been a slight uptick in over-the-year claims level, but the increase is well below the increases that occurred during the past few recessions.
