
Mustapha Hammida
July 2023
This article, the last in a three-article series on Minnesota's wage distribution, examines how growth in the measure of aggregate average hourly wage (AAHW) comes about. In particular, it evaluates the size of the two components of AAHW growth, namely "pure" wage effect and composition effect, and quantifies the contribution of different determinants of the composition effect. In addition, it sheds light on the role of the composition effect on the surprisingly high growth in the AAHW seen during the Pandemic Recession and tracks how the two effects progressed before, during and after the Pandemic Recession, spanning the years 2017 to 2022.
As COVID-19 hit the state, it caused serious job losses mostly in the lower half of the wage distribution, altering the composition of the employed population. As common to all recessions, these disproportionate job losses caused the wage distribution to shift towards higher wages, even if no continuously employed worker saw wage growth, i.e., even when "pure" wage growth was zero. Conversely, as the economy recovered and hiring picked up among those displaced workers, the shift of the wage distribution slowed. Both of these shifts disturbed the distribution statistics, including the AAHW. Changes in the AAHW (or percentiles of aggregate hourly wage) that are solely a result of the changes in the composition of employed workers are called "the composition effect," or "the extensive margin."
The Minnesota labor market experiences over half a million of movements into and out of employment in an average quarter, triggering significant changes in the composition of employed workers and causing significant effects on measures of workers' wage growth. Among continuously employed workers, average hourly wages of "stayers" (or workers who stay with the same employer) were 1.5 times higher than AAHW of "changers" (or workers who change employers) between 2017 and 2022. AAHW of continuously employed workers have been consistently increasing year-over-year, with faster growth occurring during the current recovery. However, AAHW for changers has grown faster over the period. The year-over-year growth in average hourly wages of stayers and changers has soared to 8.3% and 8.9%, respectively.
During the same period, while the growth in wages of continuously employed workers was 8.4%, the growth in the AAHW was only 5.0%. Changes in the AAHW capture growth of wages of workers who are continuously employed, or the pure effect, as well as changes in the composition of who is working at the times of AAHW measurement, or the composition effect. The difference of -3.4% between 5.0% and 8.4% is the composition effect; in other words, the growth in AAHW of 5% is equal to the sum of 8.4% and -3.4%.
The composition effect captures differences in average wages of "entrants" (or workers entering employment) and those of "leavers" (or workers leaving employment) as well as changes in the composition of worker types, including those who remain employed.
When the shares of the continuously employed workers move up (or down) over the year, the composition effect moves up (or down). Owing to the high average wages of stayers, changes in the shares of stayers wield more weight on the composition effect than similar changes in the shares of changers.
The composition effect on the AAHW is significant, averaging -2.0% since first quarter of 2018. This means that the measured growth in AAHW underestimates the actual wage growth of workers by an average of 2.0 percentage points. Over the business cycle, the composition effect varied from an average of -2.1% prior to COVID-19, to 0.2% during the Pandemic Recession, and finally to -3.4% during the current recovery. The recent excessive rate is due to soaring numbers of entrants and slowing numbers of leavers.
Over the business cycle, the composition effect can be negative or positive. When the composition effect is negative (or positive), it causes the growth in the AAHW to be an underestimation (or overestimation) of the actual, or pure, wage growth of workers.
The sign of the composition effect is driven by the state of the labor market (tight vs. slack) across the business cycle.
The composition effect arises naturally and exclusively from the employment dynamics of the labor market involving movements into and out of employment. Although these movements principally drive the numbers of jobs and workers, they are acutely implicated in the shape of the wage distribution and the behavior of its statistics. To appreciate how these benign movements affect the AAHW growth, an example can be illuminating. Table 1 gives changes in the AAHW of a hypothetical employer under selected scenarios of changes in the composition of who is employed and by the resulting direction, or lack of it, of the composition effect.
Wage growth is the increase in measured wages at two different points in time. One measure of wage growth uses the wages of all employees and compares the resulting AAHW between the starting and ending times. In the starting time, call it period (t-1), our employer had three employees and paid them an AAHW of $15.00. In addition to decisions on the size of the workforce, our employer in period t (or the ending time) could choose between two courses of wage growth for her continuing employees: keep employees' wages the same or give each employee a 5% wage raise. Three different sets of decisions are considered under each of the three possible settings of the composition effect.
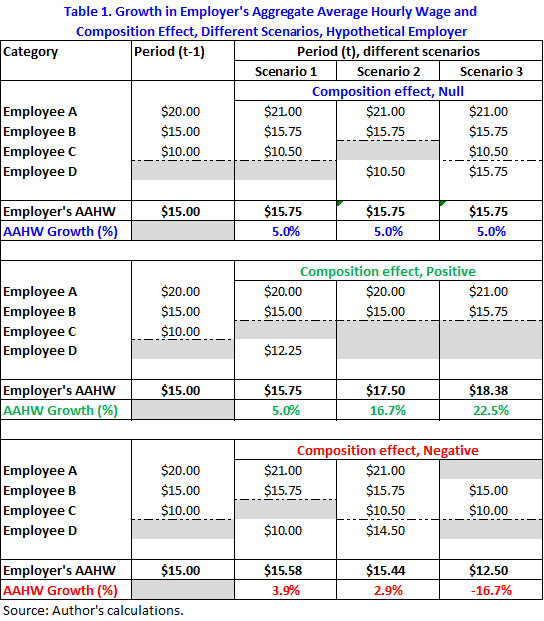
The top panel of Table 1 describes possible cases wherein the composition effect is zero. All three scenarios assume our employer increases the wages of each employee by 5%. Scenario 1 allows for no entrants and no leavers, keeping the same workforce in period t. Obviously, the employer's AAHW also increases by 5% to $15.75. Thus, eliminating entries into and exits from employment guarantees that AAHW growth is an accurate measure of the growth in workers' wages.
However, situations that involve changes in the composition of employees and that retain all of the 5% "pure" wage growth in the reported AAHW are specific and limited. Scenarios 2 and 3 allow for changes in the composition of employment but keep the composition effect at bay from the growth in the AAHW. In Scenario 2, the employer swapped employees at the same location in the wage distributions of periods (t-1) and t; in other words, the leaver and the entrant occurred at the lowest wage1 level of the distributions while the new lowest wage moved up by 5% as well. In Scenario 3, the employer expanded its workforce with one more employee hired at the new average wage of the continuing employees, $15.75. These two unique possibilities guarantee that changes in the composition of employment have no effect on the AAHW growth, which then correctly measures the wage growth of employees working in both periods of wage growth measurement.
The middle panel of Table 1 gives examples of how the composition effect can boost the AAHW, artificially pushing up the growth in the AAHW and overstating the growth in wages. Under Scenarios 1 and 2 our employer keeps the wages of its continuing employees constant. In period t:
The distinctive feature in the above three scenarios is the loss of low-paying jobs relative to higher paying jobs, or a shift of the wage distribution to higher wages — a situation typical in recessionary times. Although this leads to a high AAHW growth, which is a good economic outcome, it is an overestimation of the actual changes in the wages of workers due to the magical workings of composition effect.
The composition effect not only imposes upward pressure on AAHW but can also exert suppressing pressure under more normal, more sustained economic circumstances. The bottom panel of Table 1 describes scenarios when the composition effect artificially pushes the AAHW downward. The three scenarios, among many others, are common during the recovery and expansion stages of the business cycle. In period t:
This example shows how embedded the composition effect, caused by a tiny movement of workers, is in determining the growth of AAHW of a single employer and blurring the true wage growth of workers. Applying the changes witnessed by examining our small hypothetical employer to our state economy, where over half a million of hires and leavers occur regularly every quarter, illustrates the significance of the composition effect on the state's AAHW growth and how it changes over time. Clearly, situations wherein the growth in AAHW describes only wage growth for an economy are extremely rare. It can only happen when either (a) there are no entrants and no leavers in the economy or (b) the entrants and the leavers occur simultaneously at the same levels, proportions, and location within the wage distributions of each sector of the economy. Both of these situations are highly improbable.
Furthermore, the above example illustrates the importance of separating the employed population according to their employment status, i.e., continuously employed, leaving employment, and entering employment, in having an accurate gauge of the actual wage growth.
The analysis in this article uses individual‐level data on quarterly employment from the Minnesota Unemployment Insurance Wage Detail Report (UIWDR). For each individual, we first compute the hourly wage earned from all jobs held during the quarter (for detail on the data and wages see Article 1 of the series). The individual hourly wages serve to develop the quarterly AAHW for all workers. Our wage growth measure captures the changes in the quarterly AAHW over a year between two identical quarters. Again, we refer to year (t-1) as the starting (or previous) year and year t as the ending (or current) year.
Next, we construct for each individual the employment history over the period of analysis covering first quarter 2017 through third quarter 2022, the quarter with most recent UIWDR data. This allows us to perform two successive classifications crucial for separating the composition effect from the pure wage effect. Because our wage growth measure is annual, these classifications are by necessity annual as well.
The first one classifies jobs held by an individual worker. Between two identical quarters of successive years (t-1) and t, a job is classified as continuous if the individual is working for the same employer in both quarters. A hire is a job where the individual is working for the employer in year t but not in year (t-1). An exit is a job where the individual was working for the employer in year (t-1) but not in year t.
The second one separates workers based on the employment attachment status of their jobs in similar quarters of two successive years. Specifically, we consider:
The total number of workers in a given quarter of year (t-1) and year t are given by:
Nt-1 = NSt + NCt + NLt (= Stayerst-1 to t + Changerst-1 to t + Leaverst-1 to t) and
Nt = NSt + NCt + NEt (= Stayerst-1 to t + Changerst-1 to t + Entrantst-1 to t).
Three remarks are worth noting about the changes in worker composition between the starting and ending years. First, while the populations of stayers and changers are the same between the two similar quarters, those of leavers and entrants are dissimilar. Second, even though the numbers of stayers and changers are the same in the totals Nt-1 and Nt their shares are not the same in those totals, except when the numbers of entrants and leavers are the same which is rare. Third, as we progress in time from year to year, the composition of Nt between years (t-1) and t is different from its composition between years t and (t+1). Thus, while the number of employed workers, Nt, is the same, its composition changes to:
Nt = NSt+1 + NCt+1 + NLt+1 (= Stayerst to t+1 + Changerst to t+1 + Leaverst to t+1).
The stayers, changers, and leavers in Nt are now determined from the starting year being t and the ending year being (t+1). In addition, the stayers and changers in Nt in the two settings are not the same: Stayerst-1 to t is different from Stayerst to t+1 and Changerst-1 to t is different from Changerst to t+1.
Obviously, the changing shares of each worker type from quarter to quarter is another source of composition effect not covered in the above example of a single employer.
For similar quarters between years (t-1) and t, the different compositions of totals Nt-1 and Nt generate two separate distributions of workers. Table 2 presents the quarterly distributions of workers by employment status in the previous year (t-1) and the current year (t). The quarterly distributions under the heading "Previous year (t-1)" are related to the total number of workers Nt-1 that contains stayers, changers, and leavers. By contrast, the quarterly distributions under the heading "Current year (t)" are related to the total number of workers Nt that contains stayers, changers, and entrants.
For example, the first row of Table 2 gives the distributions of workers in the first quarter of 2017 (or starting quarter) and the first quarter of 2018 (or ending quarter). The same pool of stayers (those employed with the same primary employer in the first quarters of 2017 and 2018) accounted for 71.8% out of the total employed in first quarter 2017 (or out of Nt-1) but only 71% out of the total employed in first quarter 2018 (or out of Nt).
Similarly, the same group of workers that changed primary employers between the first quarters of 2017 and 2018 represented 18% out of the total employed in first quarter 2017 (or out of Nt-1) and 17.8% out of the total employed in first quarter 2018 (or out of Nt). These shares of stayers (and changers) diverge because the totals of leavers and entrants are different in the two overall totals, Nt-1 and Nt, respectively. Thus, changes in movements out and into employment also alter the shares of the stayers and changers in the distribution of employed workers.
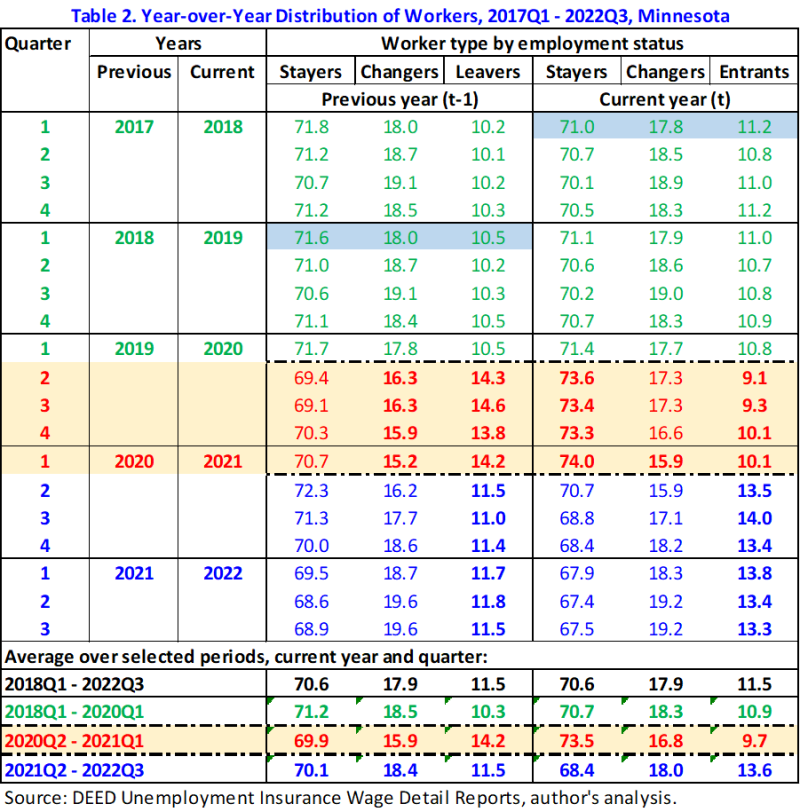
As mentioned above, the designation of a particular quarter changes from previous to current as we turn the dial for time one year ahead. For example, the statistics highlighted in blue in the first row of Table 2 describe the distribution of workers in first quarter of 2018 defined as the current quarter, while the other set of statistics highlighted in blue in the fifth row of Table 2 describe the distribution of workers in first quarter of 2018 defined as the previous quarter. In the former, the composition of workers in first quarter of 2018 is compared to the composition of workers in first quarter of 2017, thus including entrants who were not employed in first quarter of 2017. However, in the latter, the composition of workers in first quarter of 2018 is compared to the composition of workers in first quarter of 2019, thus including leavers who left employment in first quarter of 2019.
Over the whole period of analysis, the average quarterly distributions of workers by employment status between previous and current quarters are the same, up to one decimal point. On average, stayers account for 70.6%, changers account for 17.9%, and leavers and entrants each account for 11.5% in their respective distribution. However, these seemingly equal shares are a statistical artifact of averaging opposing movements across the different stages of the business cycle over the last six years. In fact, Table 2 suggests that the six years can be broken into three distinct periods according to COVID-19's effect on economic activity. Doing so reveals stark differences in the distributions of workers by employment status in each period, but the stayers keep their dominant status. This means that the composition of workers is highly responsive to fluctuations in the business cycle. In addition, on a quarterly basis no pairs of quarterly distributions in Table 2 are the same. In other words, the distributions of workers between previous and current quarters are always changing.
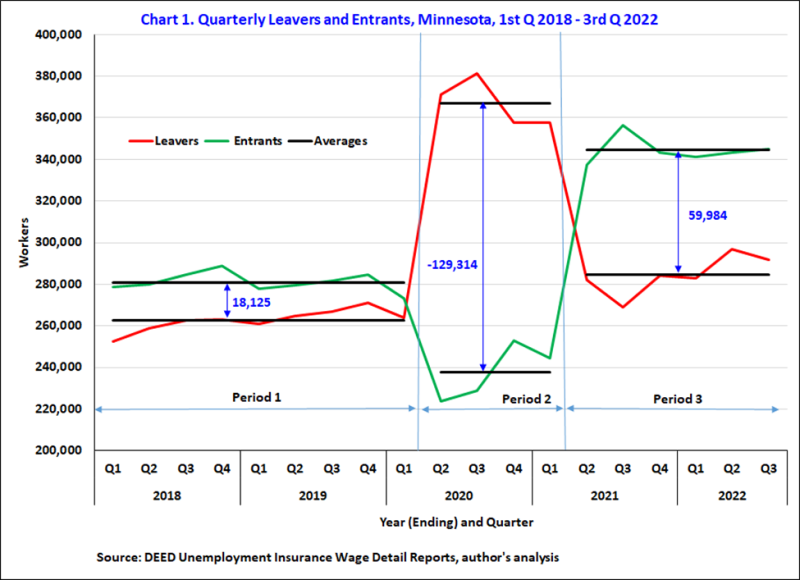
The major drivers of changes in the composition of workers are movements into and out of employment. Chart 1 also shows that the quarterly leavers and entrants are highly sensitive to the phases of the business cycle and clearly outlines the same three periods. When the economy is expanding or recovering, entrants surpass leavers, but when the economy deteriorates as it did during the Pandemic Recession, leavers overtake entrants.
Using the current quarter as a reference, this period spans nine quarters from first quarter 2018 to first quarter 2020 (Table 2, entries in green). During this period, stayers made up 71.2% of the total workforce, changers made up 18.5%, and leavers accounted for 10.3% in an average previous quarter. In addition, in an average current quarter, stayers made up 70.7%, changers made up 18.3%, and entrants accounted for 10.9%. These statistics reveal that the shares of stayers and changers are lower in the current quarter than in the previous quarter. This is not surprising given that the share of entrants in the current quarter is greater than the share of leavers from the previous quarter: the totals of entrants are larger than the totals of leavers (Chart 1). These relationships are consistent in each pair of previous-current quarters from first quarter 2017 to first quarter 2020 that covers the last part of the expansion phase of the current business cycle.
Moreover, during this period the fluctuations in leavers and entrants were contained in a narrow band. The share of leavers varied from 10.1% to 10.5% while the shares of entrants varied between 10.7% and 11.2%. Under these circumstances, the difference between the share of entrants and the share of leavers never reached one percentage point. In addition, the difference between the total numbers of entrants and leavers was about 18,000 workers, on average. However, since COVID-19 disturbed the generating processes of leavers and entrants in second quarter 2020, the shares (and total numbers) of leavers and entrants are still off those ranges.
During the next period that lasted four quarters starting with the quarter of the Pandemic Recession and extending to first quarter 2021 (Table 2, entries in red), the relationships between worker types reversed directions. On one hand, the shares of stayers and changers became lower in the previous quarter rather than in the current quarter. On the other hand, the share of leavers from the previous quarter was larger than the share of entrants in the current quarter. On average, the share of leavers jumped to 14.2% while the share of entrants dropped to 9.7%. These rates represent extremes for these worker types in all three periods.
The extreme levels of leavers and entrants persisted throughout the second period. Specifically, between second quarter 2020 and first quarter 2021, the shares of leavers remained at the highest levels while the shares of entrants remained at the lowest levels experienced throughout the full six years of analysis. The share of leavers reached its maximum level of 14.6% in third quarter 2020, one quarter after the Pandemic Recession. Conversely, entrants reached its minimum share of 9.1% immediately during the quarter of the Pandemic Recession, or second quarter 2020. In fact, leavers and entrants were significantly impacted in each of these two quarters that spanned the height of the COVID-19 onslaught on movements out of and into employment.
The economy in each of these two quarters had shares of leavers that outpaced the shares of entrants by more than 5 percentage points.
These changes are also clearly visible in the total numbers of leavers and entrants illustrated in Chart 1. On average, compared to a year ago, leavers soared to 367,000 workers while entrants crashed to 238,000 workers, resulting in a reduction of 129,000 in the pool of employed workers.
These massive shifts translated into a major shake-up in the distributions of workers. The increase in the share of leavers led to shrinkages in the shares of stayers and switchers, with switchers taking the more significant cut. However, the decline in the share of entrants coupled with the decline in switchers led to an expansion in the share of stayers within the distribution of workers in an average current quarter. Thus, in an average previous quarter stayers and switchers accounted for 69.9% and 15.9%, respectively. But in an average current quarter, these ratios were 73.5% and 16.8%, respectively. The difference in the shares of stayers, which is the main worker type, was a whopping 3.7 percentage points, compared to only -0.5 percentage points prior to COVID-19. Thus, the composition of workers between the two quarters were strikingly different.
On a quarterly basis, the largest difference in the share of stayers between previous and current quarters were in the second and third quarters of 2020, exceeding 4 percentage points. In addition, the shares of changers were consistently declining over the four quarters of this period. By first quarter 2021, they bottomed out at 15.2% and 15.9% in the previous and current quarters, respectively. Both of these shares were the lowest recorded during the full period of analysis. Clearly, the low share of changers coupled with the low share of entrants propelled the share of stayers to its highest share of 74% in first quarter of 2021.
The last distinct period describes the ongoing recovery from the Pandemic Recession and starts in second quarter 2021 through third quarter 2022 (Table 2, entries in blue), which is the most recent quarter with available UIWDR data. This period is characterized by the return of all relationships between the different types of workers to their pre-COVID-19 patterns. Specifically, the shares of stayers and changers are higher in the previous quarter than in the current quarter. And the share (and numbers) of leavers is smaller than the share (and numbers) of entrants.
Three major results are worth noting. First, changers accounted for 18.4% of the total employed in the previous quarter compared to 18.0% of the total employed in the current quarter, on average. The changers seemed to recover from their lows during the Pandemic Recession and regain the relative share they enjoyed before COVID-19. Second, stayers made up 70.1% out of the total employed in the previous quarter compared to 68.4% out of the total employed in the current quarter. These shares are still lower than their counterparts during the first period, due to still higher shares of both leavers and entrants. Finally, leavers and entrants supplied 11.5% and 13.6% to their respective distribution of workers. The share of leavers is much lower than what it was during the second period covering the Pandemic Recession but still higher than its level during the first period. Similarly, the share of entrants is much higher than its levels during both second and first periods.
In addition, the gap between the share of entrants and leavers is much bigger than during the first period (2.1 percentage points vs. half a percentage point). Chart 1 shows that on average during the third period the numbers of entrants outpaced the number of leavers by 60,000 workers. This is over three-fold the difference between entrants and leavers during the first period.
To summarize, the distribution of workers was greatly impacted by the Pandemic Recession. The shares of leavers and entrants are still off their levels of prior to the recession. Undoubtedly, the different worker distributions between and within the three periods give rise to different composition effects and impacts on the growth of the AAHW.
Capturing how the composition of workers changes over time is important in isolating the composition effect from the growth in the AAHW, but not sufficient. The other piece of the puzzle are the changes in average wages of each worker type.
Chart 2 displays the average hourly wages of stayers and changers over the last six years. For each type of worker and quarter, there are two wages: one for the starting year and the other for the ending year. Consider the stayers in third quarter 2022: these are workers employed by the same primary employers in third quarter 2021 and third quarter 2022. Between these two quarters, the stayers saw their average hourly wage jump from $37.86 to $40.49. Staying with the same two quarters, the average hourly wage of changers increased from $25.93 in 2021 to $28.61 in 2022.
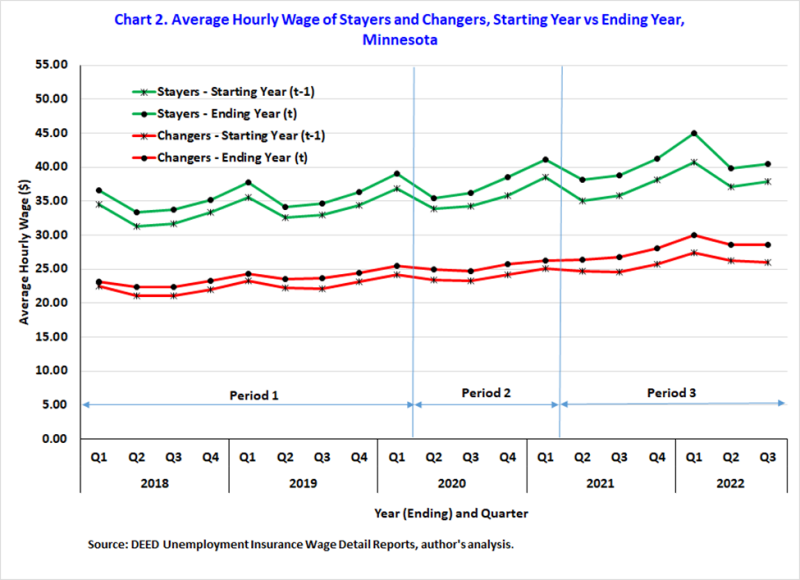
Three conclusions are clear from Chart 2. First, the average hourly wages of stayers and changers have been consistently increasing over the last six years analyzed. On a quarterly basis and across the three periods identified above, the average hourly wage at the ending year is always higher than at the starting year. Second, the year-over-year difference in average hourly wages has been widening since the Pandemic Recession for both stayers and changers. Third, the average hourly wages of stayers are significantly higher than the average hourly wages of changers. Over the whole period and in both the starting and ending years, the average hourly wages of stayers are 1.5 times higher than the average hourly wages of changers, on average. Nonetheless, the quarterly fluctuations around this mean value are not deep; the multiplier varied only between 1.4 and 1.6.
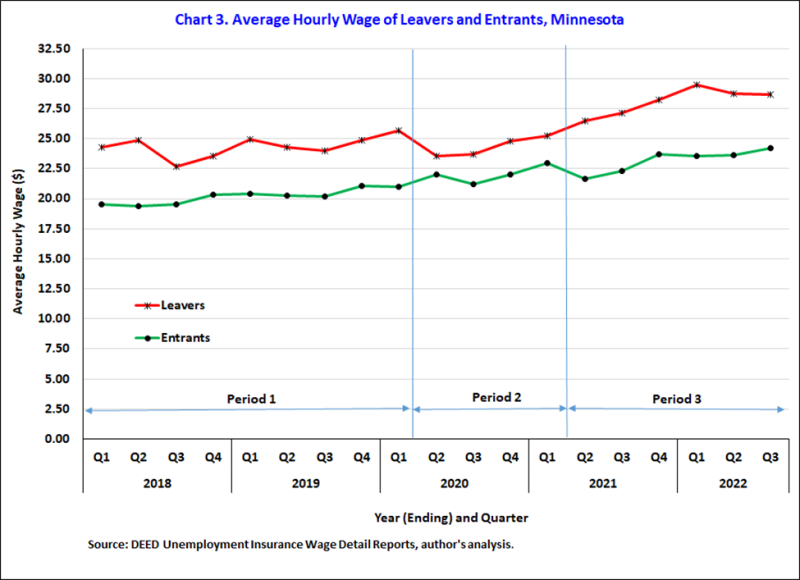
The average hourly wages of leavers and entrants are presented in Chart 3. Recall that the leavers and entrants are different populations and each group belongs to a different worker distribution and is employed in one year only. As such, in any quarter, the hourly wages of leavers represent the wages in the starting year, while the hourly wages of entrants represent the wages in the ending year. For example, leavers who left employment in third quarter 2022 were making an average hourly wage of $28.64 in third quarter 2021. In parallel, entrants who entered employment in third quarter 2022 were hired at an average hourly wage of $24.21.
Just as with stayers and changers, there is a strong relationship between the average hourly wage of leavers and entrants. Leavers are leaving from a higher average hourly wage than the one at which entrants are replacing them in the overall wage distribution. Over the whole period analyzed, the average hourly wage of leavers is 1.2 times higher than the average hourly wage of entrants. This factor was fairly stable throughout the period, except between second quarter 2020 to first quarter 2021, wherein it contracted to 1.1. Stated differently, the year-over-year difference between the average hourly wages of entrants and leavers has shrunk during the second period, which represents the Pandemic Recession, compared to the other two periods.
<>
Charts 2 and 3 give us an understanding of the relationships between the average hourly wages of different types of workers. But to be able to isolate the composition effect we also need to look at the changes in the average hourly wages of each type of worker. Chart 4 gives the year-over-year percent change (or growth) in the average hourly wage of all workers, stayers, and changers. In addition, it shows the year-over-year percent change (or drop) in the average hourly wage of leavers relative to the average hourly wage of entrants.
Two striking results are evident from Chart 4. First, the growth in the average hourly wages of stayers and changers are consistently higher than the growth in average hourly wage of all workers (or the AAHW). Second, all growth paths experience different speeds as they track through the different phases of the business cycle.
For example, during the first period, or pre-COVID-19, the growth in the average hourly wage of all workers averaged 3.5% quarterly. Then, as COVID-19 impacted the economy during the second period, it soared to 6.4%, on average. Finally, as the recovery from the Pandemic Recession took hold during the third period, it is settling around 5%, which is 1.5 percentage points higher than before COVID-19.
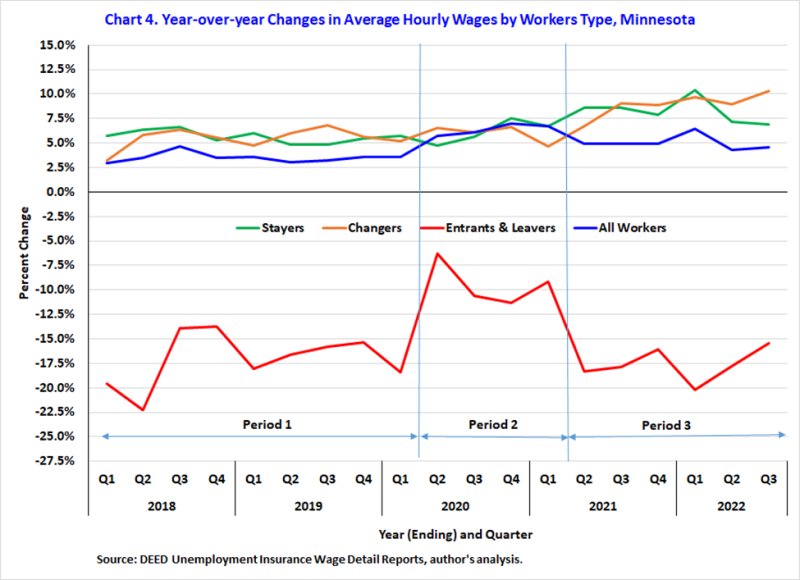
These different growth levels in the wages of all workers are associated with dissimilar paths of changes in the average hourly wages of the different worker types. Moving through the three periods:
Now that we have a clear understanding about the composition of workers, how it has changed over time, and the average hourly wages by worker type and how they changed over time, we are ready to separate the composition effect from the pure wage effect.
This analysis focuses only on the growth in the AAHW and its components and not on the growth of hourly wage percentiles6. For a given quarter, our growth measure of AAHW is simply the difference between the AAHW at the ending year and the AAHW at the starting year. Each AAHW is a weighted average of the average hourly wages of the worker types present in the appropriate year, with the shares of worker types being the weights. Specifically, the two AAHW are given by:
W̅t-1 = (NS / Nt-1) · w̅St-1 + (NC / Nt-1) · w̅Ct-1 + (NLt-1 / Nt-1) · w̅Lt-1
W̅t = (NS / Nt) · w̅St + (NC / Nt) · w̅Ct + (NEt / Nt) · w̅Et
Note that (1) a bar is used to denote an average measure of hourly wages, (2) the subscripts for the totals of stayers and changers are dropped because these totals are equal between the two years, (3) the superscripts describe worker types as before (S = Stayers, C = Changers, L = Leavers, and E = Entrants), and (4) the ratios of totals capture the shares of different worker types.
Conceptually, two major forces drive the changes in the AAHW. The first one guides the changes in the average wages of stayers and changers; this is the pure wage effect. The second one involves the changes in the average wages of leavers and entrants and all the resulting shifts in the shares of each type of worker that are triggered by the movements of leavers and entrants; the aggregate of these factors is the composition effect.
The pure wage effect is simply the wage change for the continuously employed workers, which includes the stayers and changers. Using only these workers, the average hourly wages for the continuously employed workers, denoted W̅*, are expressed as follows:
W̅*t-1 = (NS / N*) · w̅St-1 + (NC / N*) · w̅Ct-1
W̅*t = (NS / N*) · w̅St + (NC / N*) · w̅Ct,
where N* represents the total number of the continuously employed workers and is given by:
N* = NSt + NCt (= Stayerst-1 to t + Changerst-1 to t).
To isolate the pure wage effect from the composition effect, we use a shift-share analysis7 to decompose the change in the AAHW into its various components. The shift-share analysis is well suited for quantifying the contributions of various factors to the difference in the mean of an outcome variable such as hourly wages. Our goal is to have a relationship summarizing the changes in the AAHW (or, W̅t - W̅t-1) as simply the sum of two elements: the composition effect and the pure wage effect.
Working with the mathematical definitions of W̅t and W̅t-1 above, we can decompose the difference W̅t - W̅t-1 into the sum of eight monetary elements, two contribute to the pure wage effect and the other six contribute to the composition effect.
Elements of the pure wage effect:
For both these elements, positive values describe wage growth, while negative values indicate wage decline. In this analysis, since wages in the current year are higher than in the previous year, elements A and B assume positive values (Chart 2).
Elements of the composition effect:
Each of elements C and D assumes positive (negative) values when the share of the worker type increases (decreases) from starting year to ending year.
When wages of stayers and changers are growing, components E and F are negative because the differences in the shares are negative. The proportions of stayers and changers are smaller out of all workers than out of the continuously employed only.
Component G is negative as long as the wages of entrants are lower than those of leavers (Chart 3).
Component H is positive (negative) when the share of entrants is higher (lower) than the share of leavers.
The decomposition of the AAHW growth reveals that while the direction of the pure wage effect is easily determined, the direction of the composition effect is not so simple. Many motions involving wages and shares of all worker types are in play to determine the direction of the composition effect. Components C – F are due to changes in shares of stayers and changers and their hourly wages, while effects G and H are due to changes in hourly wages and shares of leavers and entrants. Still all Components C – H originate from movements out and into employment of leavers and entrants.
Moreover, the decomposition of the growth in AAHW shows that the decomposition effect disappears (or is zero) only when leavers and entrants disappear. This condition guarantees that all elements C through H are null. However, when the shares of stayers and changers are each equal between starting and ending years, leavers and entrants have equal shares and equal average hourly wages it does not guarantee no composition effect, because changes in the composition of stayers and changers would still exist; in other words, elements E and F do not vanish.
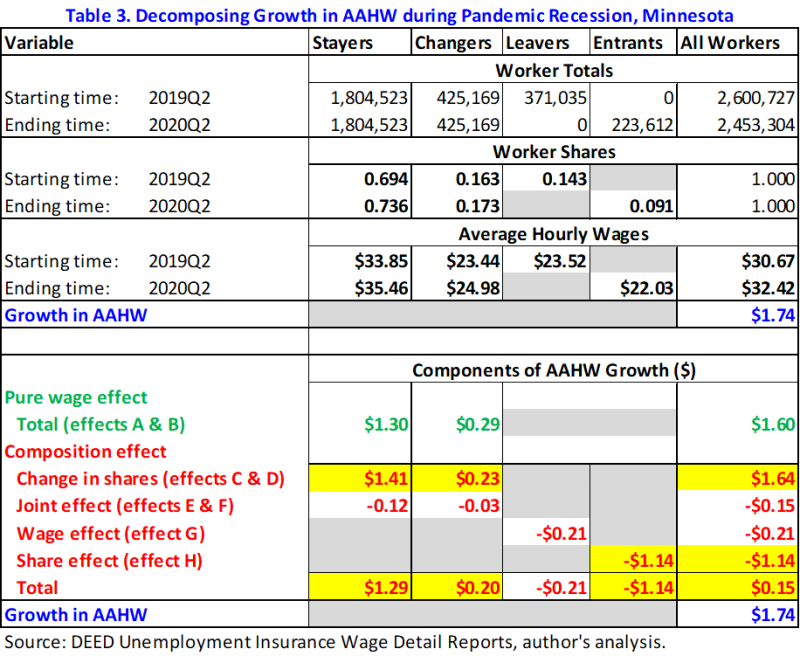
To grasp how the composition effect alters the growth in the AAHW, we review a couple of estimates of the composition effect. The first one looks at the growth of AAHW during the Pandemic Recession. In this quarter, the AAHW suddenly spiked to 5.7% while it was averaging 3.5% over the previous two years. In absolute terms, it grew by $1.74 from $30.67 in second quarter8 2019 to $32.42 in second quarter 2020. Table 3 gives the totals, the shares, and average hourly wages by worker type. It also gives estimates of each of the hidden eight effects that gave rise to the $1.74 increase in AAHW.
Collecting the appropriate components together, the pure wage effect contributed9 $1.60 and the composition effect added $0.15 to the $1.74 (the penny difference is due to rounding). This means that the pure, or actual, wage growth was smaller than the growth in the AAHW, which was magnified by the composition effect. In relative terms, the actual wage growth was only 5.0%, while the composition changes incorporated in the growth of AAHW amounted to 0.7%.
Although the total composition effect appears small, it is a blend of some significant but opposing effects. Firstly, the expansion of leavers and the reduction of entrants and the widening of their shares led to a large downward drag on the AAHW growth in the amount of -$1.14 (or effect H). Secondly, the difference between the average hourly wages of leavers and entrants further pushed down the AAHW growth by -$0.21 (or effect G). Thus, the direct effect of changes in leavers and entrants depressed the changes in AAHW by -$1.35, or by -4.3%, almost cancelling all the pure wage growth.
The changes in leavers and entrants that occurred in second quarter 2020 also have indirect effects on the shares of stayers and changers. As the number of entrants shrank and the number of leavers swelled (Chart 1), the shares of stayers and changers got bigger in second quarter 2020 compared to second quarter 2019. Finally, these changes in the shares of stayers and changers collectively pushed the growth in AAHW upward by $1.50, or 5% (i.e., from effects C thru F).
Thus, the collection of the two opposing forces gives us the composition effect ($1.50 - $1.35 = $0.15 and 5% - 4.3% = 0.7%).
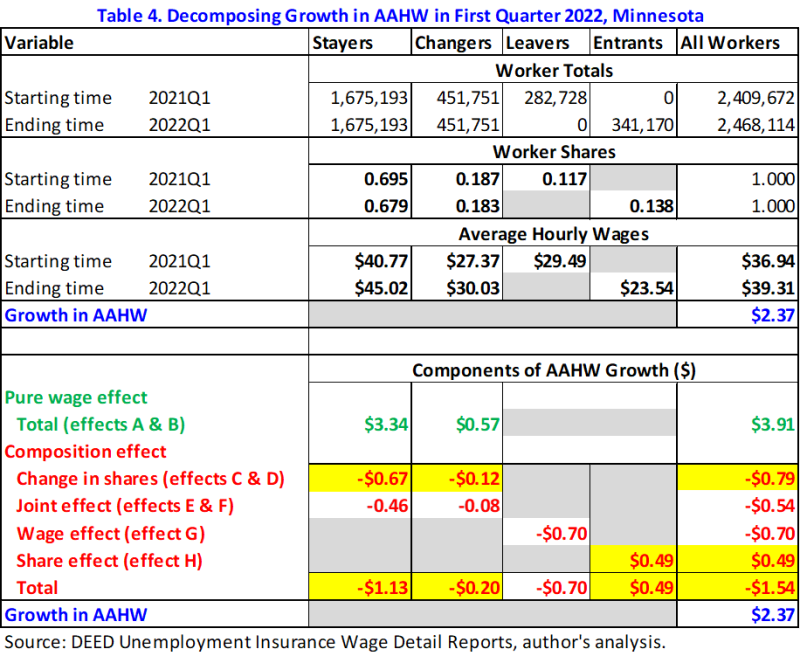
We have seen earlier that average hourly wages and shares of all worker types are exhibiting different patterns in the current recovery from the Pandemic Recession. So, how is the composition effect interacting with growth in the AAHW in this phase of the business cycle? Our second example considers first quarter 2022, wherein growth in the AAHW was highest at 6.4% during this period. Table 4 gives estimates of the components of the growth in AAHW along with their related statistics by worker type.
The AAHW went up by $2.37 between first quarter 2021 and first quarter 2022. Decomposing this wage change results in a pure wage effect of $3.91 and a composition effect of -$1.54. These results are completely opposite to those of the last example depicting the Pandemic Recession. The pure wage growth of stayers and changers is now higher than the reported growth of AAHW because of the dampening (or negative) impact of the composition effect. Instead of the 6.4% shown in the AAHW, the actual wage growth is 10.3%. This implies that composition effect was a significant negative 3.9%.
Inspecting the composition effect shows that all components susceptible to a reversal in signs have changed signs (entries highlighted in yellow in Tables 3 and 4). First, as the numbers of entrants expanded and those of leavers shrank, the difference in their shares turned positive and produced the only lift, amounting to $0.49, to the growth of the AAHW from all components of the composition effect. Second, as the shares in stayers and changers got smaller in first quarter 2022 compared to first quarter 2021, they resulted in a downward pull (or -$0.79) on the growth of AAHW. Both of these components have taken opposite signs and smaller sizes compared to the previous example of second quarter 2020.
Meanwhile, all components C – F of the composition effect that involve the shares of stayers and changers were negative and stripped away -$1.33 from the growth of AAHW. Finally, although the average hourly wages of leavers continue to be higher than that of entrants, the wage effect is much bigger at -$0.70 because of how large the difference in those wages has gotten (Chart 3).
The examples of Tables 3 and 4 emphasize how different economic conditions influence the distribution of workers, the composition effect, and the measure of growth in the AAHW. But how consistent is the behavior of the composition effect over time? And how has pure wage growth been evolving through the three periods: pre-COVID-19, during the Pandemic Recession, and post-Pandemic Recession?
Charts 5 and 6 provide us with answers. Chart 5 plots the estimates of the quarterly composition effects and reveals three striking results. First, the composition effect is significant, averaging -2.0% since first quarter of 2018. This means that the composition effect significantly disturbs the measured AAHW downwards with 2.0 percentage points10. However, it is important to recognize that the composition effect has not always been negative.
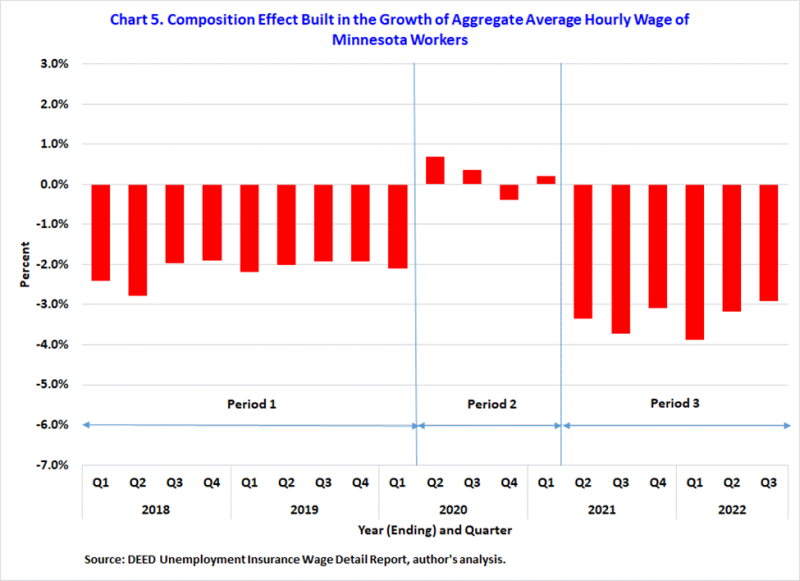
Second, the composition effect changes direction - or sign - opposite to the direction of the business cycle. When the economy is expanding (such as period 1) or recovering (such as period 3), the composition effect is negative. Then as the economy tumbled during the Pandemic Recession (such as period 2), the composition effect turned positive.
During the first period, the composition effect averaged -2.1%, varying from a large value of -2.8% to a small value of -1.9%. Moving through the short second period, the composition effect changed direction and averaged 0.2%, reaching its maximum of 0.7% during the quarter of the Pandemic Recession. Like all recessions, large spikes in the number of leavers coupled with reductions in the number of entrants cause the difference in the shares of the continued employed between years t and (t-1) to change direction, which in turn results in the reversal of the direction of the composition effect. Another reversal in the direction of the composition effect happened as the recovery took hold, bringing high jumps in the number of entrants and slowing the number of leavers.
Third, although the composition effect returned to its negative forces of the pre-COVID-19, it is deploying them more vigorously. In the current recovery, the composition effect is averaging -3.4%, reaching a sizeable value of -3.9% in first quarter of 2022. However, since then it is on a slowing trend, reaching in third quarter of 2022 a value of -2.9%, which is still higher than the maximum value seen prior to the Pandemic Recession. Undoubtedly, these high values of the composition effect are the result of higher levels of both leavers and entrants compared to their levels during the last expansion (see Chart 1).
More precisely, they are the result of many forces acting in tandem. First, the large differences in the shares of stayers and changers between previous and current years have a higher cost due to the higher hourly wages of these workers (components C and D). Second, the fast growth in the wages of stayers and changers tag another high cost to the changes in the shares of stayers and changers (components E and F). Finally, the widening wage disparity between leavers and entrants inflict yet an additional higher cost (component G).
For example, comparing these three costs between third quarter 2022 and third quarter 2018 we can see how elevated these costs are during the current recovery. While growth in AAHW were $1.58 and $1.32, respectively, the costs were: (1) components C and D: -$0.64 vs -$0.22, (2) components E and F: -$0.37 vs -$0.21, and (3) component G: -$0.51 vs -$0.32.
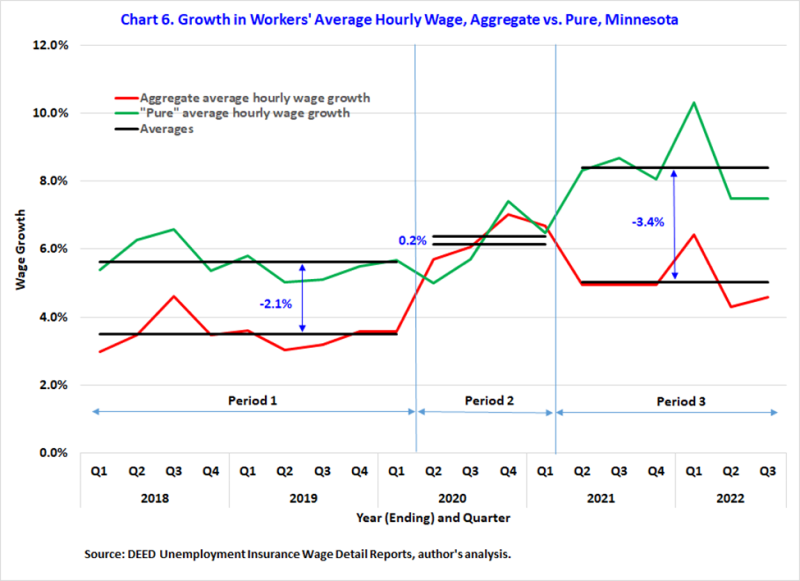
The changes in sign and size of the composition effect cause different effects on the growth of AAHW. Clearly, negative (or positive) values of the composition effect lead to underestimation (or overestimation) of actual wage growth of workers in the measured AAHW. As seen in Chart 6, the positive composition effect gives the impression of a higher growth in AAHW during the Pandemic Recession. Although the AAHW was growing at 6.4%, the pure wage effect was 6.2%.
By contrast, negative values of the composition effect drag down growth in the AAHW and understate the pure wage growth. Compared to its small size during the Pandemic Recession, the composition effect is significantly large when the economy is growing, thus markedly dampening wage growth. During the last two years of the previous economic expansion, while growth in AAHW was 3.5%, the pure wage growth, or growth in the wages of the continuously employed workers was 5.6%.
The underestimation of the growth in AAHW to the actual growth of average hourly wages of workers is even more pronounced during the current recovery from the Pandemic Recession. Between second quarter 2021 and third quarter 2022, growth in the AAHW was running at 5.0% on average. This is considerably less than the average of 8.4% growth in the actual wage growth. As seen earlier (Charts 1 and 3), the still higher number of leavers and the soaring numbers of entrants coupled with the widening in their respective average hourly wages are exerting a powerful drag down on the growth of AAHW. As a result, this measure of wage growth discounts the significant leaps currently occurring in the wages of both stayers and changers (Chart 4).
Changes in the AAHW are a good measure of the general health of the economy. However, it is not powerful enough to describe the pure wage growth in workers who are continuously employed. By its construction, growth in the AAHW captures not only growth of wages of workers who are continuously employed, but also changes in the composition of who is working at the times of AAHW measurement. These changes bias the growth in the AAHW and the impact of the bias is influenced by the business cycle.
The compositional effect is counter-cyclical and significantly dampens the wage growth profile during periods of economic recovery and expansion. The powerful effect of the COVID-19 pandemic on the labor market has caused significant shifts to the composition effect. During the ongoing recovery from the Pandemic Recession, the composition effect is still larger than its levels before COVID-19. The current high levels of the composition effect are driven by the enduring high levels of leavers and entrants.
Growth in the average hourly wages of continuously employed workers is very strong. Both stayers and changers have been posting exceptional wage growth since the end of the Pandemic Recession. The impressive wage growth is somewhat blurred in the growth of the AAHW. Thus, it is important from a policy point of view to supplement the growth of the AAHW with estimates of the compositional effect, the wage growth of continuously employed workers, and the average wages of leavers and entrants.
1The designation of wages as lowest, low, high, or highest is specific to the hypothetical employer and not a description of any conventional classification of wages within the wage distribution of the population of all workers in the economy.
2Scenario 3 involves the same worker leaving employment as in scenario 2 yet the composition effects are not the same. This implies that there are other factors besides just the movement into and out employment at play in the composition effect.
3The primary employer for workers with a single job in a given quarter is straightforward. However, for workers who hold more than one job, the primary employer is defined as the employer with whom the worker has a strong attachment and a long employment duration in the quarter. Specifically, jobs are first grouped in a descending order from continuous to hire then to exit. Then, jobs are ordered by number of hours worked during the quarter by job type. The primary employer is the one associated with the highest ranked job. For example, an individual with two jobs reported to the UIWDR in each of the two quarters (t-1) and t: one continuous, one exit, and one hire, we define the primary employer as the one associated with the continuous job and classify her as "Stayer."
4Because our definitions of employment status compare employment only between quarters that are one year apart, they ignore possible changes in employment status between successive quarters. Thus, they are not measures of employment dynamics during the entire year. For example, a "leaver" does not mean that the individual was out of employment for a full year. In fact, it is possible that a "leaver" in first quarter of year t was employed in all quarters of year (t-1) and not only in first quarter of year (t-1).
5Likewise, an "entrant" does not mean that the individual was out of employment for a full year. It is possible that an "entrant" in first quarter of year t was employed in all quarters of year (t-1) except for first quarter of year (t-1).
6Mean measures of wages are easily amenable to simple decomposing procedures because means (or averages) are linear functions. However, considering percentiles that are nonlinear functions requires more complex decomposing procedures. (See for example: The Intensive and Extensive Margins of Real Wage Adjustment.)
7Shift-share analysis is popular in regional economic analysis to evaluate the changes in variables such as employment of localities compared to the changes in the state and/or national employment, usually to identify leading and lagging industries within the local regions. For an example of using it in decomposing average hourly wages, see: How Shifting Occupational Composition has affected the Real Average Wage.
8The AAHW for second quarter 2019 reported in this article is $30.67 which is slightly different from the one reported in article 2 of this series ($30.68). Although both estimates are computed from the same data set, the estimation methodologies are different. In the first two articles, the hourly wages are derived from data of just the quarter of interest. In this article, to capture labor dynamics data for a particular quarter are linked to multiple quarters, which may lead to some records not usable due to data issues across quarters.
9The estimates of effects from the shift-share analysis are simply measures of the contribution of each effect to the growth of the AAHW. Although they are important in sorting through the changes in the AAHW, they don't give us any help in how or why those effects act upon the AAHW. Thus, the estimates cannot be viewed as measures of causation.
10For comparison purposes, a study using data from the Current Population Survey estimate that for the U.S. the composition effect averaged -0.80 over the period first quarter 1982 to fourth quarter 2018. (See: Real Wages Grew During Two Years of COVID-19 After Controlling for Workforce Composition.)