by Mark Schultz
October 2017

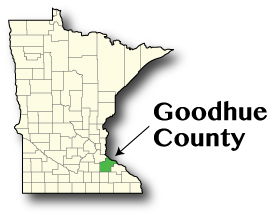
Goodhue County was formed on March 5, 1853. Hamline University was initially in the city of Red Wing, but it closed its doors in the midst of the Civil War because enrollment was too low, before opening again in 1869, this time in St. Paul. During the mid-1800's, Goodhue County was a leader in wheat production, enjoying the largest production of wheat country-wide and shipping the wheat up and down the mighty Mississippi River. However, between two mill fires in Red Wing in the 1880's and the changing transportation landscape from developing railroad routes, by the beginning of the 1900's farmers in surrounding counties began to ship their wheat to mills located in Minneapolis.
Goodhue County saw a population increase of almost 6,000 residents from 1990 to 2016, a jump of 14.7 percent. Additionally, the county's labor force also saw a significant increase during this 16-year period, increasing by over 5,800 people (27.9 percent). Despite this increase in population and labor force, Goodhue County is an exporter of labor, with more residents leaving the county (13,456) for work than commute in from other counties (10,154) than who live and work in the county (11,317). The largest number of the workers commute into the county from Pierce County, WI, and Dakota County, MN, while the highest number of residents commute to Olmsted and Dakota Counties for work. As the economy continues to tighten, the population of Goodhue County is anticipated to decline by almost 2,000 people (4.1 percent), and the labor force is projected to see a similar decline of about 1,330 workers (5.5 percent).
Four industries make up just over 75 percent of the 21,473 total jobs in Goodhue County: Manufacturing (20.7 percent in 90 firms), Trade, Transportation, and Utilities (20.6 percent in 330 firms), Education and Health Services (20.3 percent in 149 firms), and Leisure and Hospitality (15.1 percent in 129 firms). Food Manufacturing makes up the largest portion of the 4,453 Manufacturing sector jobs at 15.3 percent, followed by Plastics and Rubber Manufacturing which comprises 10.8 percent. Since 2006 the total number of jobs in the county has increased by 0.6 percent (131 jobs). Despite this general increase across all industries, only the Manufacturing and Education and Health Services sectors saw an increase in jobs, with Manufacturing jumping 16.2 percent (948 jobs) and Education and Health Services seeing an increase of 10.2 percent (419 jobs). Trade, Transportation, and Utilities dropped by 8.1 percent (391 jobs), and Leisure and Hospitality saw a decline of 3.2 percent (109 jobs).
| 2016 Estimates | Goodhue County | Minnesota |
|---|---|---|
| Population | 46,676 | 5,519,952 |
| Labor Force (8/2017) | 26,903 | 3,3,082,329 |
| Average Unemployment (8/2017) | 3.3% | 3.6% |
| Average Household Income (2015) | $72,699 | $80,444 |
| Cost of Living (Individual) | $28,136 | $29,856 |
| Cost of Living (Average Family) | $51,125 | $55,200 |
| Source: U.S. Census Bureau, DEED Local Area Unemployment Statistics, American Community Survey, DEED Cost of Living Survey | ||
| Top Industries of Employment | Total Employment, 2016 | Percent Change 2006-2016 | Average Annual Wages | Percent Change 2006-2016 |
|---|---|---|---|---|
| Total, All Industries | 21,473 | 0.6% | $44,460 | 34.9% |
| Manufacturing | 4,453 | 16.2% | $49,920 | 19.6% |
| Trade, Transportation, and Utilities | 4,418 | -8.1% | $52,780 | 43.8% |
| Education and Health Services | 4,361 | 10.6% | $44,616 | 34.9% |
| Leisure and Hospitality | 3,253 | -3.2% | $25,584 | 27.1% |
| Source: DEED Quarterly Census of Employment and Wages 2006-2016 | ||||

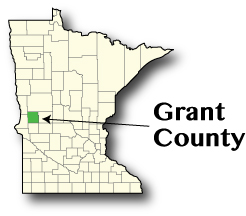
Grant County came to be in 1868 and was named after the 18th president, Ulysses S. Grant. The county seat is Elbow Lake although the only stoplight in Grant County is in Herman, and it is also home to three ghost towns – Hereford, which is now home to a single cemetery, Pomme de Terre, which met its end when a railroad was not built through it, and Thorsborg,
Grant County experienced a decrease of 290 residents from 1990 to 2016, shrinking 4.6 percent. Despite this decrease in population, the labor force in Grant County saw a 15 percent increase, 427 people, during this 16-year period. While approximately 1,076 residents remain in the county for work, a substantial number (1,597) of residents leave the county for their jobs while only 925 non-residents commute into the county for work. Otter Tail and Douglas Counties send the most non-residents into the county for work as well as the being the counties that most Grant County residents commute to for work, Douglas receiving more than Otter Tail. The county's population is projected to decline 347 people from 2020 to 2040 (5.9%) and, as the economy continues to tighten, the labor force is projected to also see a decline estimated at a loss of 127 workers (4.4 percent).
Of the total industries within Grant County, four comprise 72.5 percent of the estimated 1,870 jobs, including Education and Health Services (31.7 percent in 20 firms), Trade, Transportation, and Utilities (23.5 percent in 56 firms), Construction (10 percent in 36 firms), and Public Administration (8.1 percent in 19 firms). In general, the county saw a small decrease in total jobs in the last 10 years (2006-2016), a drop of only 10 jobs (0.5 percent), with both the Education and Health Services and Construction super sectors seeing declines of 12 (2 percent) and 11 jobs (6 percent), respectively. Despite these job declines, Trade, Transportation, and Utilities saw a rather significant increase of 104 jobs (31.0 percent) while Public Administration experienced a much smaller increase of 12 jobs (8.6 percent).
| 2016 Estimates | Grant County | Minnesota |
|---|---|---|
| Population | 5,956 | 5,519,952 |
| Labor Force (8/2017) | 3,262 | 3,082,329 |
| Average Unemployment (8/2017) | 3.2% | 3.6% |
| Average Household Income (2015) | $64,181 | $80,444 |
| Cost of Living (Individual) | $27,359 | $29,856 |
| Cost of Living (Average Family) | $45,196 | $55,200 |
| Source: U.S. Census Bureau, DEED Local Area Unemployment Statistics, American Community Survey, DEED Cost of Living Survey | ||
| Top Industries of Employment | Total Employment, 2016 | Percent Change 2006-2016 | Average Annual Wages | Percent Change 2006-2016 |
| Total, All Industries | 1,870 | -0.5% | $36,348 | 46.5% |
| Education and Health Services | 592 | -2.0% | $34,476 | 51.0% |
| Trade, Transportation, and Utilities | 440 | 31.0% | $37,128 | 33.2% |
| Construction | 172 | -6.0% | $41,340 | 36.8% |
| Public Administration | 151 | +8.6% | $40,456 | 49.6% |
| Source: DEED Quarterly Census of Employment and Wages 2006-2016 | ||||

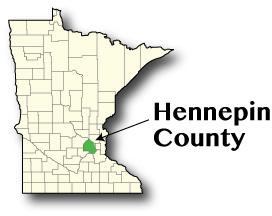
Hennepin County was established on March 6, 1852, and Minneapolis was chosen as the county seat two years later. Originally, the plan was to name it Snelling County, but to honor Father Louis Hennepin, who first explored the area in 1680, the name Hennepin County was chosen. During its formative years the county population's commitment to public education was evident as residents in almost every township approved school funding. By 1851 public schools were up and running in the city of Minneapolis, and the University of Minnesota was chartered.
Over the last 16 years Hennepin County experienced an increase of 200,052 residents or 19.4 percent. The county's labor force also increased 10.1 percent or 62,342 participants during this time. The county's population and labor force are also projected to increase, with the population estimated to grow by just over 204,000 (15.8 percent) and the labor force, despite a tightening labor market, is expected to see growth of about 43,300 participants or 6 percent growth. Almost 461,500 people both live and work in the county, but a large number (166,367) of residents leave to work outside of the county. However, Hennepin County is a labor importer with a substantial number of workers (over 447,000) commuting into the county for their jobs. Ramsey and Dakota counties send in the most commuters, but also draw the most Hennepin County residents for work.
Just over 71 percent of the total jobs across all industries within Hennepin County is made up of four industries – Education and Health Services (21.9 percent or 197,592 jobs in 4,542 firms), Professional and Business Services (21.7 percent or 195,623 jobs in 8,105 firms), Trade, Transportation, and Utilities (18.1 percent or 163,393 jobs in 7,223 firms), and Financial Activities (9.5 percent or 85,198 jobs in 4,394 firms). In general, the county saw a decent sized increase in total jobs in the last 10 years (2006-2016), with a jump of 58,291 jobs (6.9 percent). Interestingly, in 2006 Education and Health Services was the third largest industry, but with a jump of 24.2 percent (38,474 jobs) it was number one in 2016. Additionally, Professional and Business Services added an additional 34,288 jobs during this time, a jump of 21.3 percent. Unfortunately, both Trade, Transportation, and Utilities and Financial Activities saw declines of 3.4 percent (5,654) and 5.3 percent (4,485) jobs, respectively, from 2006 to 2016.
| 2016 Estimates | Hennepin County | Minnesota |
|---|---|---|
| Population | 1,232,486 | 5,519,952 |
| Labor Force (8/2017) | 707,001 | 3,082,329 |
| Average Unemployment (8/2017) | 3.5% | 3.6% |
| Average Household Income (2015) | $92,879 | $80,444 |
| Cost of Living (Individual) | $31,724 | $29,856 |
| Cost of Living (Average Family) | $61,777 | $55,200 |
| Source: U.S. Census Bureau, DEED Local Area Unemployment Statistics, American Community Survey, DEED Cost of Living Survey | ||
| Total Employment | Total Employment, 2016 | Percent Change 2006-2016 | Average Annual Wages | Percent Change 2006-2016 |
|---|---|---|---|---|
| Total, All Industries | 901,225 | 6.9% | $66,872 | 26.5% |
| Education and Health Services | 197,592 | 24.2% | $53,456 | 18.3% |
| Professional and Business Services | 195,623 | 21.3% | $86,996 | 33.5% |
| Trade, Transportation, and Utilities | 163,393 | -3.4% | $57,824 | 26.8% |
| Financial Activities | 85,198 | -5.3% | $107,380 | 32.6% |
| Source: DEED Quarterly Census of Employment and Wages 2006-2016 | ||||

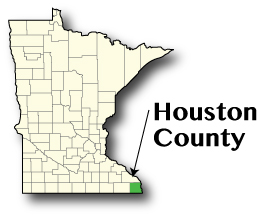
Situated in the southeast corner of the state, Houston County saw its beginning in 1854 when a land office opened in the city of Brownsville. Its position in the state made it a "natural entry point" when the first settlers were moving in from the east. Spanning about 24 miles top to bottom, and close to the same size east to west, the county is located in the "Driftless area," which is a small portion of the Midwest region that was safe from the coverage of ice and glaciers that occurred during the last stage of glaciation.
From 1990 to 2016 Houston county saw a small increase in the population, jumping from 18,497 to 18,814 (317 residents or 1.7 percent). During the same 16 years, the labor force saw over double that, gaining 716 participants (7.3 percent). Unfortunately, the population and labor force are projected to decrease in the future, with the population expected to drop by 1,710 (9.1 percent) from 2016 to 2040 and the labor force projected to drop by 1,477 (14.9 percent) from 2016 to 2030. Of the workers in the county, 3,450 both live and work in the county while an additional 2,125 commute in from the surrounding areas. Houston County, however, is a net exporter of labor with almost 6,500 county residents leaving the county for their jobs. The county sees the most non-residents commuting in from La Crosse and Winona Counties as well as sends the most residents to the same two counties for work.
2016 annual averages show that an estimated 71.2 percent of all jobs in Houston County are made up of only four industries. Those four industries are Education and Health Services (1,556 jobs, 30.2 percent in 55 establishments), Trade, Transportation, and Utilities (1,044 jobs, 20.3 percent in 89 establishments), Manufacturing (600 jobs, 20.3 percent in 23 establishments), and Public Administration (469 jobs, 9.1 percent in 16 establishments). Overall, Houston County saw a very small decrease in the number of jobs from 2006 to 2016, dropping by only five, a change of just 0.1 percent. Surprisingly, given that the Southeast region is a bit of a powerhouse when it comes to Manufacturing, that industry saw a significant decline in jobs throughout the county, dropping by almost 30 percent (28.4 percent) during this time period, going from 838 Manufacturing jobs in 2006 to 600 jobs in 2016. The remaining three industries that make up the top four all saw increases ranging from 4.7 percent (21 more jobs in Public Administration) to 9.3 percent (133 additional Education and Health Services jobs).
| 2016 Estimates | Houston County | Minnesota |
|---|---|---|
| Population | 18,814 | 5,519,952 |
| Labor Force (8/2017) | 10,297 | 3,082,329 |
| Average Unemployment (8/2017) | 2.9% | 3.6% |
| Average Household Income (2015) | $64,686 | $80,444 |
| Cost of Living (Individual) | $26,941 | $29,856 |
| Cost of Living (Average Family) | $47,017 | $55,200 |
| Source: U.S. Census Bureau, DEED Local Area Unemployment Statistics, American Community Survey, DEED Cost of Living Survey | ||
| Top Industries of Employment | Total Employment, 2016 | Percent Change 2006-2016 | Average Annual Wages | Percent Change 2006-2016 |
|---|---|---|---|---|
| Total, All Industries | 5,150 | -0.1% | $32,236 | 28.2% |
| Education and Health Services | 1,556 | 9.3% | $30,264 | 23.3% |
| Trade, Transportation, and Utilities | 1,044 | 6.7% | $31,096 | 29.7% |
| Manufacturing | 600 | -28.4% | $37,388 | 43.2% |
| Public Administration | 469 | 4.7% | $29,432 | 30.7% |
| Source: DEED Quarterly Census of Employment and Wages 2006-2016 | ||||