by Dave Senf
July 2019
Note: All data except for Minnesota’s PMI have been seasonally adjusted. See the feature article in the Minnesota Employment Review, May 2010, for more information on the Minnesota Index.
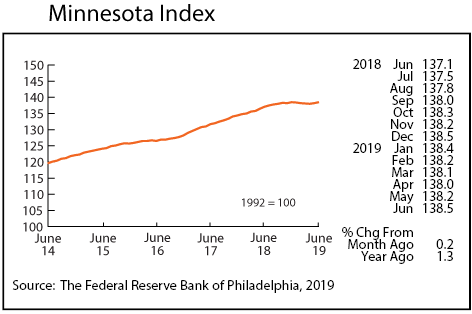
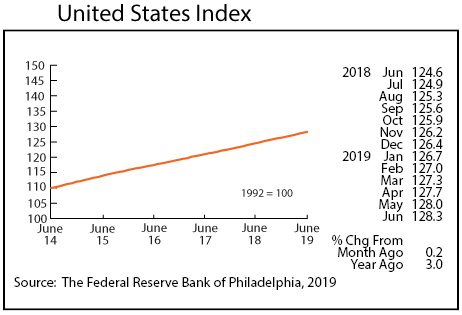
The Minnesota Index advanced for the second month in a row in June, moving 0.2 percent. June’s 138.5 reading matched the previous high achieved last December. The upswing in the index was caused by average weekly manufacturing hours climbing and wage and salary employment inching up. The state’s unemployment rate remained at 3.3 percent for the third consecutive month. The U.S. Index also increased 0.2 percent for the second straight month in June.
June’s reading was 1.0 percent higher than a year ago which is the lowest over-the-year gain since February 2019. The U.S. index was up 3.0 percent over the same period. Minnesota’s index has historically averaged 2.7 over the year compared to the 1.8 percent average gain over the first half of 2019. The state’s tight labor market is in all likelihood curbing Minnesota’s economic growth rate.
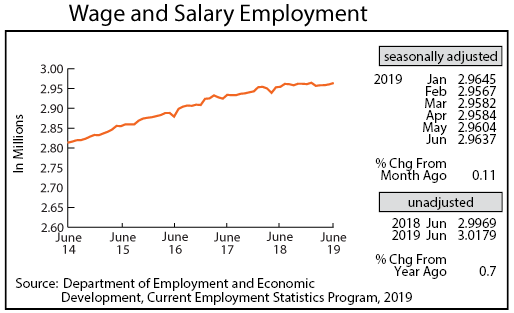
Adjusted Wage and Salary Employment increased for the fifth month this year as 3,300 jobs were added in June. Revisions to May’s job estimate were high, making the increase in jobs over the last two months the largest two-month increase since last August. Minnesota’s seasonally adjusted wage and salary employment is up only 2,600 through the first half of 2019. Job growth during the first half of the year between 2010 and 2018 averaged 18,000. Minnesota employers have job vacancies but are struggling to fill the vacancies.
Private sector job creation accounted for 3,100 of the 3,300 jobs added in June. The goods-producing sector added 1,300 workers while the service-providing sector added 2,000. The goods-producing sector is down 200 jobs through the first half of the year while 2,800 workers have been added to the service-providing sector. Educational and Health Services added the most jobs along with Other Services and Manufacturing. Professional and Business Services cut the most jobs. Employment was up 0.7 percent from a year ago, using unadjusted job numbers in Minnesota, compared to 1.5 percent for the U.S. The 0.7 percent jump for Minnesota was the highest in eight months.
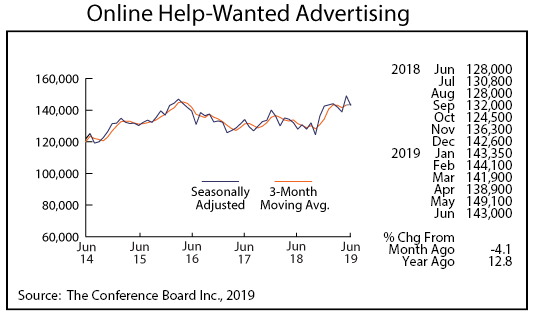
After reaching an all-time high in May, Online Help-Wanted Ads retreated by 4.1 percent in June to 143,000. Online postings also fell nationally, declining 1.5 percent. Online help-wanted ads for jobs in Minnesota have averaged 102,700 postings monthly since the Conference Board first started publishing this labor demand proxy in June 2005. Minnesota’s share of online help-wanted ads slipped slightly to 2.7 percent while its share of U.S. wage and salary employment remained at 2.0 percent.
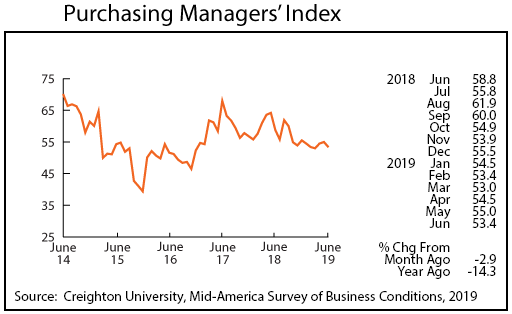
Minnesota’s Purchasing Managers’ Index (PMI) dipped for the first time in three months to 53.4. One of the comparable indices, the Mid-America Business Index, rose to 55.4 while the other comparable index, the Institute of Supply Management’s national PMI, declined to 51.7. Minnesota’s reading indicates growth in the state’s manufacturing sector for the 39th consecutive month, but the rate of expansion has slowed noticeably from a year ago.
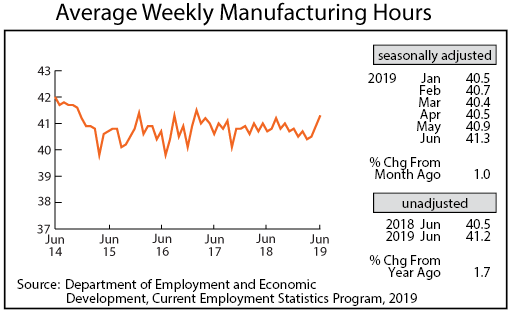
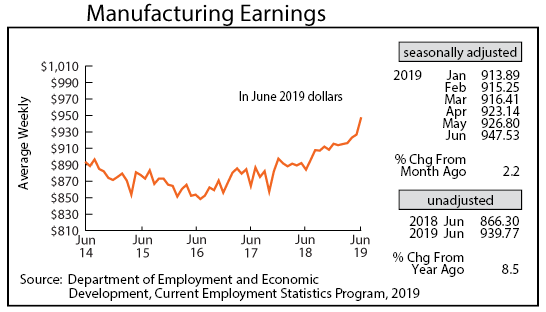
Adjusted average weekly Manufacturing Hours increased for the third straight month in June, climbing to 41.3 hours, the longest factory workweek since February 2017. Manufacturers may be increasing overtime in response to hiring problems. The longer workweek helped boost average weekly Manufacturing Earnings, adjusted for inflation and seasonality, to $947.53 in June, setting another record-high pay level. Over-the-year unadjusted-for-seasonality real pay was up 8.5 percent over the year. The significant pay increase probably reflects wages manufacturers are having to pay in the tight job market.
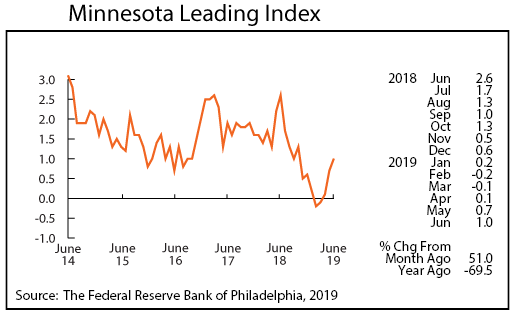
The Minnesota Leading Index advanced for the third consecutive month in June after having slipped below zero in February and March. June’s reading of 1.0 is the highest in eight months. The upswing in the state’s index suggests that economic growth over the next six months will be accelerating. The U.S. index was 1.3, indicating that Minnesota’s economic growth over the next six month will continue to lag behind U.S. growth.
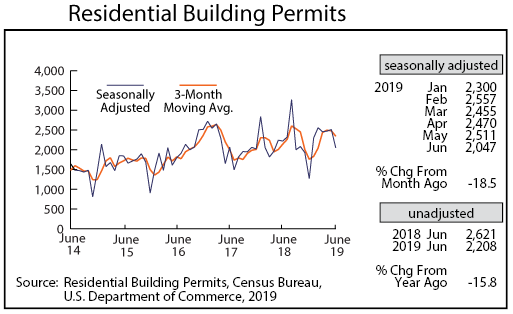
Residential Building Permits fell off in June to 2,047, the lowest monthly total so far this year, but home-building permits have been solid over the first half of 2019, running 9.6 percent higher than last year. This year’s total for the first six months is the highest since 2006.
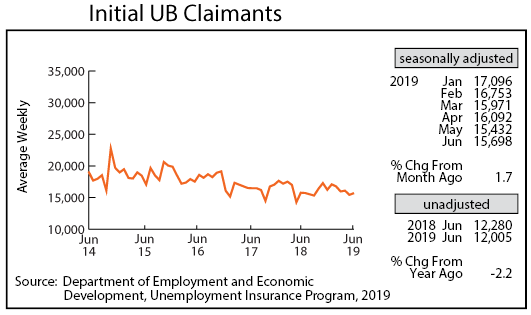
Adjusted Initial Claims for Unemployment Benefits (UB) inched up to 15,698 in June. Initial claims levels remain extremely low by historical standards and continue to point towards employers’ hanging on to their employees in tight labor market times.
