by Luke Greiner
August 2018

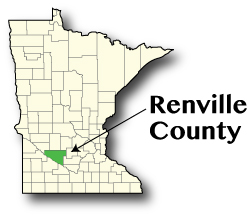
Renville County was named after a somewhat famous pioneer and fur trader, Joseph Renville, who became a leader helping maintain peace between white settlers and the Sioux Indian tribe. Joseph Renville was sent to Canada at the age of 10 to learn the French language and the Catholic religion, after which he returned to Minnesota and established a trade outpost at Lac qui Parle. Today Renville County is known for its agricultural innovation, including seed crop breeding and research.
Like Many counties in the southwestern portion of Minnesota the continual population decline has had some negative effects for the residents of Renville County. With an increasingly tight labor market it might prove difficult to keep or attract new businesses to the county. However, as wages continue to rise it's possible that a larger share of residents will stay in the county to benefit from lower costs of living and solid wage growth.
Renville County has been in population decline for the better part of a century at this point, yet employment has been able to grow since plummeting during the last recession. By 2017 employment in Renville County was just 100 jobs less than the pre-recession peak.
Growth in employment has been a bit inconsistent, with an ebb and flow occurring in many of the larger industry sectors like Manufacturing, Retail Trade, Public Administration, and very notably in Construction.
The chart below shows the major industries in Renville county, their number of jobs, and the average wage.
Average annual wages are healthy in particular industries, at more than $50,000 in Financial Activities, Professional and Business Services, and Manufacturing. In the last five years average annual wages have outpaced inflation by 3 percent.
| Economy | ||
|---|---|---|
| 2017 Estimates | Renville County | Minnesota |
| Population | 14,645 | 5,576,606 |
| Labor Force | 8,527 | 3,046,697 |
| Average Unemployment | 4.7% | 3.6% |
| Median Household Income (2016) | $54,824 | $63,217 |
| Cost of Living, Individual | $27,088 | $31,656 |
| Cost of Living, Average Family | $45,944 | $57,624 |
| Source: U.S. Census Bureau, DEED LAUS, American Community Survey, DEED Cost of Living | ||
| Industry | |||||
|---|---|---|---|---|---|
| Top Employing Industries | 2017 | 2012 - 2017 | |||
| Number of Firms | Number of Jobs | Average Wage | Change in Jobs | Change in Wages | |
| Total, All Industries | 579 | 5,999 | $39,572 | 469 | $3,536 |
| Education and Health Services | 52 | 1,273 | $34,424 | 6 | $6,396 |
| Trade, Transportation, and Utilities | 153 | 1,279 | $39,156 | 61 | $3,952 |
| Leisure and Hospitality | 35 | 849 | $23,868 | 575 | $15,964 |
| Professional and Business Services | 38 | 213 | $55,432 | -26 | $12,740 |
| Source: DEED, Quarterly Census of Employment and Wages | |||||

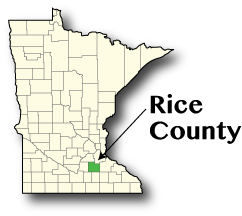
Rice County is named after Henry M. Rice, a fur trader who first came to Minnesota from Vermont in 1839. Henry Rice helped the government work with American Indians to negotiate treaties. He came to what is now Rice County in 1844 with General Sumner and a pack of mules that carried provisions. The county seat is Faribault, also the largest city in the county. The city of Northfield is also noteworthy for the Jesse James Gang bank robbery of 1876, where the final heist of this notorious band of outlaws took place.
Despite a steady population growth trend (18th fastest of 87 counties) since 2000, the county's population is expected to stagnate and decline less than 1 percent through 2030. This population projection creates a negative labor force projection out to 2030, mainly from the further aging of an already older-than-typical labor force with fewer young workers to replace them. However, Rice County's proximity to the urban centers of Minneapolis and St. Paul and access to I-35 could help stave off problematic population declines.
With nearly 66,000 people in 2017, Rice County is now the 14th largest county in the state. As a result, the labor force expanded to nearly 37,000 workers, which was 3,900 more workers in 2017 than in 2002. The tightening labor force combined with an expanding economy to create a decreasing unemployment rate, dropping to just 3.2 percent in 2017.
Despite some job declines in 2008, 2009, and 2010, the county had 1,650 more jobs in 2017 than it did leading into the last recession. The chart below shows the major industries in Rice county, their number of jobs, and the average wage.
| Economy | ||
|---|---|---|
| 2017 Estimates | Rice County | Minnesota |
| Population | 65,968 | 5,576,606 |
| Labor Force | 36,863 | 3,063,604 |
| Average Unemployment | 3.2% | 3.6% |
| Median Household Income (2016) | $61,683 | $63,217 |
| Cost of Living, Individual | $30,493 | $31,656 |
| Cost of Living, Average Family | $53,785 | $57,624 |
| Source: U.S. Census Bureau, DEED LAUS, American Community Survey, DEED Cost of Living | ||
| Industry | |||||
|---|---|---|---|---|---|
| Top Employing Industries | 2017 | 2012 - 2017 | |||
| Number of Firms | Number of Jobs | Average Wage | Change in Jobs | Change in Wages | |
| Total, All Industries | 1,545 | 24,831 | $44,928 | 1,975 | $5,824 |
| Education and Health Services | 233 | 7,244 | $45,708 | -18 | $3,016 |
| Trade, Transportation, and Utilities | 325 | 4,908 | $39,416 | 561 | $4,680 |
| Manufacturing | 82 | 4,569 | $61,412 | 809 | $7,384 |
| Leisure and Hospitality | 153 | 2,233 | $16,276 | -130 | $3,796 |
| Source: DEED, Quarterly Census of Employment and Wages | |||||

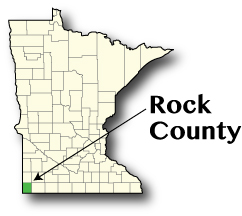
Located in the far southwestern corner of the state, Rock County borders both Iowa and South Dakota. Established in 1857 by the Original Act, the county's name comes from the vast quantity of rock within its borders. Population peaked at 11,864 people in 1960 and has since leveled off at 9,490 residents.
Like many counties in Southwest Minnesota, Rock is expected to have little or no population growth in the future. By 2040 the projected population is 9,490, the exact same estimate of the population in 2017. Although no net growth is expected, growth within certain age groups should occur, specifically for people 75 years or older and those 25 to 44 year olds. Historically low unemployment rates combined with a projected 3.3 percent labor force decline by 2030 means employers should expect current tight labor market conditions to persist into the foreseeable future.
Despite declining population over the last decade, the county's labor force continues to grow, albeit relatively slowly. With an annual unemployment rate just over 2 percent in 2017, the labor market is tight, possibly explaining some of the mostly unchanged employment levels over the past four years. By 2017 the annual average wage reached $38,549. While employment grew by a meager 0.4 percent from 2016 to 2017, the average annual wage grew by 9.5 percent or 7.8 percent after adjusting for inflation. The chart below labeled Rock County Employment shows the major industries in the county, their number of jobs, and the average wage.
| Economy | ||
|---|---|---|
| 2017 Estimates | Rock County | Minnesota |
| Population | 9,490 | 5,576,606 |
| Labor Force | 5,857 | 3,063,604 |
| Average Unemployment | 2.2% | 3.6% |
| Median Household Income (2016) | $52,835 | $63,217 |
| Cost of Living, Individual | $26,381 | $31,656 |
| Cost of Living, Average Family | $44,854 | $57,624 |
| Source: U.S. Census Bureau, DEED LAUS, American Community Survey, DEED COL | ||
| Industry | |||||
|---|---|---|---|---|---|
| Top Employing Industries | 2017 | 2012 - 2017 | |||
| Number of Firms | Number of Jobs | Average Wage | Change in Jobs | Change in Wages | |
| Total, All Industries | 296 | 3,593 | $38,532 | 406 | $7,748 |
| Education and Health Services | 26 | 1,108 | $36,140 | 38 | $5,408 |
| Trade, Transportation, and Utilities | 74 | 727 | $34,684 | 67 | $5,408 |
| Financial Activities | 29 | 401 | $68,484 | 147 | $28,704 |
| Manufacturing | 14 | 366 | $43,316 | 50 | $3,484 |
| Source: DEED, Quarterly Census of Employment and Wages | |||||

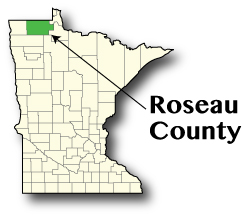
Bordering Canada, Roseau County is the birthplace of snowmobiling. Established in 1894 by Governor Knute Nelson, the area was previously the eastern portion of Kittson County. The tax roll in 1894 listed all of 228 settlers scattered about the area. Almost 40 percent of the county is open access state or county parks, forests, or wildlife areas.
Despite the last few decades of population loss, the most worrisome trend could be the decline in Manufacturing employment. Since half of all jobs in the county are provided by Manufacturers – easily the highest concentration of any county in the state – Roseau County's economy is highly dependent on conditions in the Manufacturing sector.
The county's population has been up and down over the last 70 years, declining to a low of 11,569 people in 1970, then peaking at 16,338 people in 2000, before declining to the current population of 15,327. Similar to population trends of late, the labor force has also been slowly declining since 2003. Interestingly, the last few years have found higher than normal rates of unemployment, despite the county's enduring the recession and remaining below the statewide average between 2008 and 2013.
The rocky employment levels look to be a contributing factor to the inconsistency. Employment in Roseau County expanded after the recession, yet failed to recover fully to prerecession levels and by 2015 started to show weakness again. From 2014 to 2017 more than 800 jobs disappeared from the county. The chart below labeled Roseau County Employment shows the major industries in the county, their number of jobs, and the average wage.
| Economy | ||
|---|---|---|
| 2017 Estimates | Roseau County | Minnesota |
| Population | 15,327 | 5,576,606 |
| Labor Force | 8,180 | 3,063,604 |
| Average Unemployment | 5.0% | 3.6% |
| Median Household Income (2016) | $54,827 | $63,217 |
| Cost of Living, Individual | $25,571 | $31,656 |
| Cost of Living, Average Family | $43,148 | $57,624 |
| Source: U.S. Census Bureau, DEED LAUS, American Community Survey, DEED Cost of Living | ||
| Industry | |||||
|---|---|---|---|---|---|
| Top Employing Industries | 2017 | 2012 - 2017 | |||
| Number of Firms | Number of Jobs | Average Wage | Change in Jobs | Change in Wages | |
| Total, All Industries | 455 | 8,047 | $44,824 | -331 | $4,212 |
| Manufacturing | 26 | 3,964 | $55,952 | -300 | $4,836 |
| Education and Health Services | 42 | 1,382 | $38,792 | 38 | $4,680 |
| Trade, Transportation and Utilities | 119 | 987 | $28,392 | -38 | $3,172 |
| Leisure and Hospitality | 52 | 539 | $17,940 | 15 | $1,404 |
| Source: DEED, Quarterly Census of Employment and Wages | |||||