by Carson Gorecki
January 2022
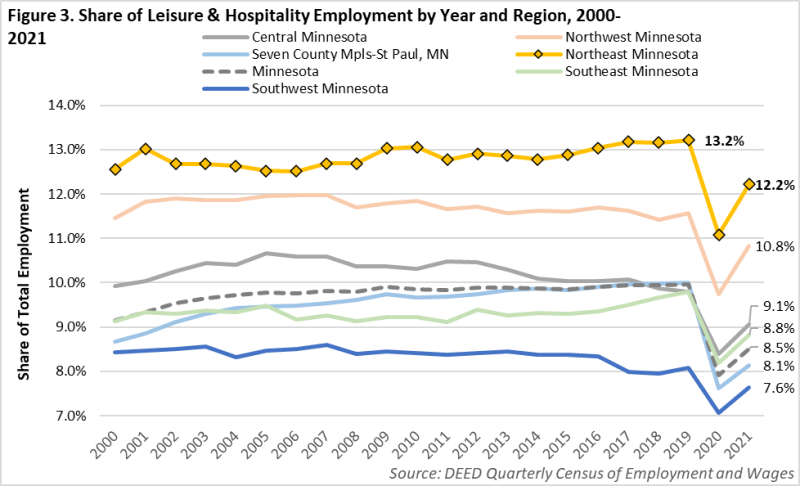
The Leisure and Hospitality supersector is an integral component of Northeast Minnesota's regional economy. With over 16,300 jobs and 12.2% of employment through the first three quarters of 2021, the supersector is the third largest, following only Retail Trade (12.3%) and Health Care and Social Assistance (24.5%). Leisure and Hospitality employment is also more concentrated in the region. Northeast Minnesota had the highest share of Leisure and Hospitality of the six planning regions. Prior to the onset of COVID-19 pandemic, the portion of Leisure and Hospitality jobs in Northeast Minnesota expanded. From 2000 to 2019 the portion of jobs within the supersector grew from 12.6% to a high of 13.2% in 2019.
Behind the 0.6 percentage point increase was a numeric addition of nearly 1,400 jobs over 20 years. Over the same period, Northeast Minnesota gained only 3,600 jobs across all industries. By this measure, Leisure and Hospitality accounted for almost 40% of the net employment growth in the region, further cementing its key role in our economic future. However, the pandemic has hit few sectors harder, eliminating decades of employment growth and exacerbating an already tight labor market. How these workforce issues are addressed will be of critical importance to the Leisure and Hospitality sector's ability to continue to thrive.
According to the North American Industry Classification System (NAICS) – the gold standard of industry taxonomy – the Leisure and Hospitality supersector consists of the smaller Arts, Entertainment, and Recreation and Accommodation and Food Services sectors. Within those sectors are several smaller industries and sub-industries such as Accommodation and Spectator Sports (see Table 1). These many industries share in common the provision of services often in the form of lodging, meals, beverages, or cultural, entertainment, and recreational opportunities.
| Table 1. Northeast Minnesota Leisure and Hospitality Industry Details, 2019-2021 | ||||
|---|---|---|---|---|
| Industry | 2021 Employment | 2021 Establishments | 2021 Average Annual Wage | Percent Employment Change 2019-2021 |
| Total, All Industries | 133,673 | 8,885 | $50,596 | -7.0% |
| Leisure and Hospitality | 16,331 | 1,187 | $20,748 | -14.0% |
| Arts, Entertainment, and Recreation | 3,185 | 253 | $27,248 | -15.5% |
| Performing Arts, Spectator Sports, and Related Industries | 291 | 53 | $18,668 | -8.2% |
| Performing Arts Companies | 88 | 17 | $19,223 | -13.6% |
| Spectator Sports | 87 | 9 | $18,044 | 43.8% |
| Promoters of Performing Arts, Sports, and Similar Events | 79 | 16 | $21,181 | -30.7% |
| Independent Artists, Writers, and Performers | 37 | 11 | $13,711 | -8.9% |
| Museums, Historical Sites, and Similar Institution | 299 | 36 | $25,671 | -14.6% |
| Amusement, Gambling, and Recreation Industries | 2,594 | 164 | $28,409 | -16.4% |
| Gambling Industries | 1,020 | 5 | $37,752 | -31.3% |
| Other Amusement and Recreation Industries | 1,540 | 154 | $22,637 | -2.3% |
| Accommodation and Food Services | 13,146 | 935 | $19,136 | -13.6% |
| Accommodation | 3,064 | 269 | $22,863 | -18.5% |
| Traveler Accommodation | 2,816 | 235 | $23,227 | -17.1% |
| RV (Recreational Vehicle) Parks and Recreational Camps | 201 | 25 | $18,564 | -28.7% |
| Rooming and Boarding Houses | 46 | 9 | $18,477 | -41.2% |
| Food Services and Drinking Places | 10,083 | 666 | $18,079 | -12.0% |
| Special Food Services | 234 | 23 | $14,768 | -22.5% |
| Drinking Places (Alcoholic Beverages) | 925 | 124 | $13,711 | -9.1% |
| Restaurants | 8,922 | 519 | $18,599 | -12.0% |
| 2021 data consist of Q1-Q3 averages. Source: DEED Quarterly Census of Employment and Wages | ||||
As COVID-19 began to spread in the U.S. in spring 2020, efforts to mitigate its propagation took shape. Many of these efforts included the closure of places where people were more likely to gather in person such as bars, restaurants, and entertainment venues. Combined with a general decline in demand for these types of experiences, the Leisure and Hospitality establishments shouldered the brunt of negative pandemic employment impacts. From second quarter 2019 to second 2020, Minnesota saw a loss of nearly 360,000 jobs (12.3%) across all industries. Over the same period the statewide Leisure and Hospitality supersector lost over 134,000 jobs, a decline of -46%. Despite accounting for about 10% of all jobs, Leisure and Hospitality represented almost two of every five lost early in the pandemic. Since the low point of employment in second quarter 2020, 103,100 jobs were added, a recovery of about 77% of those lost.
Leisure and Hospitality employment in Northeast Minnesota saw a greater decline in 2020 than in other regions of the state but has also experienced an above average rate of recovery. Northeast Minnesota had about 8,000 fewer Leisure and Hospitality jobs in the second quarter of 2020 compared to the 2019 annual average, equivalent to a percent decline of 41.9% (see Figure 1). Only the Twin Cities Metro saw a larger percentage decline of jobs in the supersector (49.0%) over that period. However, since the low point of second quarter 2020, Leisure and Hospitality employment has grown faster than the all-industry average in Northeast Minnesota. While total employment remained 5% below the 2019 average in third quarter 2021, Leisure and Hospitality employment was only 1.5% below its 2019 mark. As the supersector was digging out from a deficit twice the size of all other industries, Leisure and Hospitality employment grew almost nine times faster than total employment from 2020 to 2021.
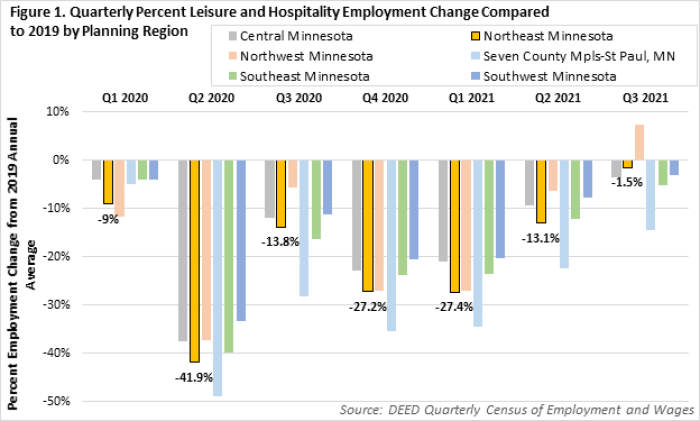
Much of the employment recovered in the supersector was achieved between second and third quarters 2021 where 2,200 jobs were added alone. This recent growth is encouraging, but also likely reflects the seasonal nature of Leisure and Hospitality employment trends in Northeast Minnesota. Third quarter is traditionally the high point of the summer tourism season in the region, and employment increases reflect the cycles of increased demand. Leisure and Hospitality employment over the past 20 years was 10% higher in the third quarter than the annual average. The second quarter is usually the second-highest quarter, about 1.8% higher than the annual average. To address the issue of seasonality, we can use the average of the first three quarters of 2021, in which Leisure and Hospitality employment remained 14% below the 2019 annual average.
Some Leisure and Hospitality sectors and industries have fared better than others throughout the pandemic. As of third quarter 2021 the Accommodation and Food Services sector remained 13.6% below 2019 levels. Food Services and Drinking Places, comprising the bulk of the sector employment, was down 12%. Accommodation accounted for the other quarter of sector employment and remained down 18.5%. The smaller Arts, Entertainment, and Recreation sector was down 15.5%. In 2021 the sub-industries that were closest to, or in some cases even exceeding, 2019 levels are Spectator Sports (43.8%), Other Amusement and Recreation Industries (down 2.3%), Independent Artists, Writers, and Performers (down 8.9%), and Drinking Places (down 9.1%) (see Table 1). Other Amusement and Recreation Industries which includes golf course, ski facilities, marinas, bowling, fitness centers, and other recreation activities, was one of the few to weather the pandemic rather well. Specifically, the sub-industry that includes outdoor adventure operations, mini golf, day camps, and youth sports increased from before the pandemic, perhaps benefiting from a surge in demand for activities less likely to be impacted by the virus.
The sub-industries that have seen the weakest rebound thus far are Rooming and Boarding Houses (down 41.2%), Gambling Industries (down 31.3%), Promoters of Performing Arts, Sports, and Similar Events (down 30.7%), and RV Parks and Recreational Camps (down 28.7%). These sub-industries saw percent declines more than double the Leisure and Hospitality average but accounted for only 8.2% of all Leisure and Hospitality employment.
Leisure and Hospitality jobs are some of the lowest paying both locally and nationally. In 2021 the $20,748 annual average wage was just over 41% of the average for all industries and the lowest of all sectors (see Table 1). Among Leisure and Hospitality industries, the highest average wages were Gambling Industries ($37,752), Traveler Accommodation ($23,227), and Other Amusement and Recreation Industries ($22,637). The lowest paying industries were Drinking Places ($13,711), Independent Artists, Writers, and Performers ($13,711), and Special Food Services ($14,768), which includes food contractors, caterers, and mobile food servers.
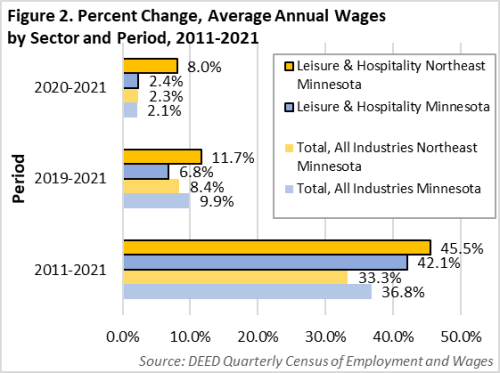
Northeast Minnesota's Leisure and Hospitality wages are lower than other industries but have grown faster over the short and long terms. Since 2011 Leisure and Hospitality average wages have grown over 45% - equivalent to a non-inflation adjusted increase of $6,500 in annual income, outpacing the sector wage growth at the state level and all other sectors. More recently, Leisure and Hospitality wages continued strong gains, increasing 11.7% since 2019 and 8% over the last year alone (see Figure 2). Only Natural Resources and Mining outpaced the Leisure and Hospitality wage growth over the past two years.
While the pandemic has severely affected Leisure and Hospitality employment, the longer-term trend has been one of relative concentration and above-average growth. Since 2000 Northeast Minnesota has maintained the highest share of employment in Leisure and Hospitality of all regions in the state (see Figure 3). Of the 87 counties in the state, four of the top 13 most concentrated Leisure and Hospitality employment are in Northeast Minnesota and all seven are in the top 23. Cook County alone had 35.4% of its jobs in the third quarter of 2021 in the supersector, the second highest share of all counties behind only Mahnomen (41.9%). The counties in Northeast Minnesota with the highest shares of Leisure and Hospitality employment were also the least populated.
The Leisure and Hospitality workforce is younger, more diverse, and contains more women than the all-industry average. Among the different demographic profiles, the largest discrepancy from other industries is by age. The Leisure and Hospitality supersector has more than double the average share of jobs held by workers 24 years or younger (see Figure 4). At the other end of the age spectrum, while the share of Leisure and Hospitality jobs held by workers 65 years or older is about equal to that of all industries, the share of 45-64 workers is about 40% lower.
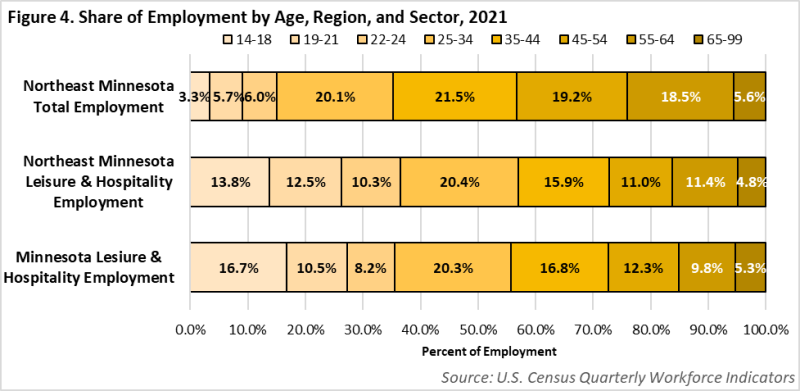
Over the last 10 years workers 55 years and older have increased in number and share within the Leisure and Hospitality workforce. The number (up 187) and share (up 3.8 percentage points) of teenage workers also increased over this time. The largest Leisure and Hospitality employment group by age, 25-34 year-olds, declined nearly 30%, but the largest declines were seen in the 45-54 age group which lost over 1,000 workers over the decade. Meanwhile, overall Leisure and Hospitality employment fell 20%. Most of that employment decline can be attributed to the pandemic. The sector expanded 9.4% from 2009-2019, before contracting 16% over just one year from 2019-2020.
The regional Leisure and Hospitality workforce is slightly more female than the all-industry average with 53.5% of jobs held by women compared to 51.1%. Notably, the gender wage discrepancy that exists across the average of all industries is effectively eliminated in Leisure and Hospitality. In 2020 the median hourly wage in Leisure and Hospitality was $13.29 for women and $13.10 for men. By comparison, across all industries the median wage for women is just over 80% of the median wage for men1. Despite this, wages in leisure and Hospitality remain some of the lowest of all supersectors. The average Leisure and Hospitality wage in 2021 was just under $21,000 a year, less than half the annual average wage for all industries (see Table 1).
The regional Leisure and Hospitality workforce is also more racially and ethnically diverse than the general workforce. Over 12% of Leisure and Hospitality workers identified as a person of color in 2021. For all industries the workers of color share was less than 8%. Black or African American workers were more than twice as likely to be working in Leisure and Hospitality than in all other sectors. Workers that identified with Two or More Races were 1.7 times more likely to be employed in the sector, followed closely by Hispanic or Latino workers who were 1.6 times more likely (see Figure 5).
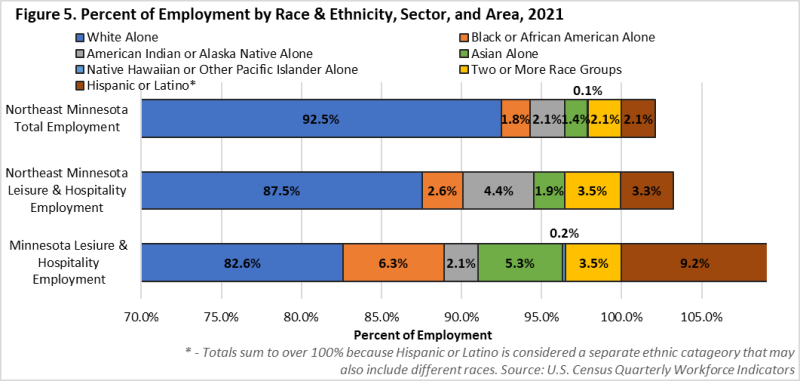
Leisure and Hospitality jobs filled by workers of color grew 10 times faster from 2009 to 2019. In fact, their employment accounted for more than half of the sector's employment growth over the 10-year period. The fastest-growing group was Black or African Americans, which more than doubled into 2019. Two or More Races employment grew 66%, and Hispanic or Latino employment expanded 51%. Overall, the number of jobs held by workers of color grew 52% (789 jobs), driven by these three groups.
Despite the noticeably adverse employment impacts in the Leisure and Hospitality sector over the last two years, many reports show that demand has rebounded much more quickly, even surpassing pre-pandemic levels in some cases. If workforce challenges persist, they will limit the ability of Leisure and Hospitality businesses from capturing strong demand. In many cases this means a lower effective operating capacity as restaurants do not have enough servers to manage all their tables, and hotels do not have the housekeeping staff to turn over a full slate of rooms.
Whether this is a new reality for the sector remains to be seen, but the impacts of the pandemic on the Leisure and Hospitality sector were clear even early on. In the four quarters leading up to the pandemic, 42% of workers who left Leisure and Hospitality jobs ended up in another job in the Leisure and Hospitality sector. That share was down to 33% in second to fourth quarters 20202. Increased demand for workers across all industries has contributed to increasing wages, but those industries with higher wages to begin with are likely to be more competitive and attractive for Leisure and Hospitality workers looking for opportunities elsewhere. How the workforce challenges are addressed will go a long way in determining the future of a sector that has become increasingly important in Northeast Minnesota.