by Nick Dobbins
February 2017
Monthly analysis is based on unadjusted employment data.
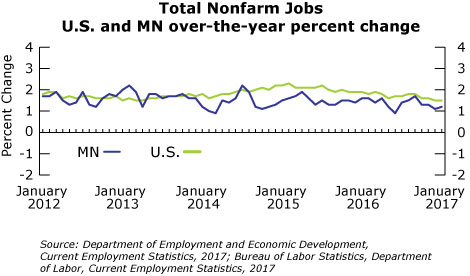
Employment in the Minneapolis-St Paul MSA decreased by 36,406 (1.8 percent) in January. Other Services was the only supersector to expand for the month, adding 317 jobs (0.4 percent). The steepest decline came in Trade, Transportation, and Utilities, which lost 12,840 jobs (3.5 percent). While the metro area’s large total job loss may look bleak. each of the previous three Januarys have shown losses of more than 2 percent. On an over-the-year basis the metro area added 27,617 jobs (1.4 percent). The only supersector to lose jobs on the year was Leisure and Hospitality, which was off by 1,487 (0.9 percent), with all of those losses coming in Accommodation and Food Services (down 2,503 or 1.7 percent). Among supersectors that saw annual growth, notable increases occurred in Other Services (up 2,585 or 3.3 percent), Government (up 6,602 or 2.7 percent), and Educational and Health Services (up 8,147 or 2.6 percent).
The Duluth-Superior MSA lost 2,779 jobs (2.1 percent) in January. Trade, Transportation, and Utilities was the big loser, dropping 1,057 jobs (4.1 percent) with losses in Retail Trade and in Transportation, Warehousing, and Utilities as well. Government employers also showed notable losses, off 654 jobs (2.4 percent), with declines in all three levels of Government (Federal, State, and Local). The only supersector to gain employment in January was Other Services, which added 12 jobs (0.2 percent). Over the year, employment in Duluth was up slightly as the MSA added 168 jobs (0.1 percent) over January of 2016. The gain is largely thanks to an over-the-year increase of 937 jobs (12.1 percent) in the Mining, Logging, and Construction supersector, the first month since July of 2015 that the supersector did not show an annual job loss. Supersectors with annual job losses in Duluth included Leisure and Hospitality (down 483 or 3.7 percent), Professional and Business Services (down 318 or 3.9 percent), and Trade, Transportation, and Utilities (down 323 or 1.3 percent).
Employment in the Rochester MSA was down by 1,887 (1.6 percent) in January. Losses were driven by Mining, Logging, and Construction (down 437 jobs or 10.6 percent), Trade, Transportation, and Utilities (down 558 or 3 percent), and Educational and Health Services (down 538 or 1.1 percent). The only two supersectors to add jobs in January were Manufacturing (up 244 or 2.3 percent) and Information (up 15 or 0.8 percent). Annually, the Rochester MSA added 872 jobs (0.8 percent). Educational and Health Services helped push the annual gains by adding 994 jobs (2.1 percent) over January 2016. Other supersectors to see notable growth included Manufacturing (up 328 or 3.2 percent) and Other Services (up 109 or 2.8 percent). Supersectors to shed jobs included Trade, Transportation, and Utilities (down 277 or 1.5 percent), Professional and Business Services (down 174 or 3.2 percent), and Information (down 62 jobs or 3.2 percent).
Employment in the St. Cloud metropolitan statistical area was down in January by 2,559 (2.3 percent). Mining, Logging, and Construction had the largest proportional decline, off by 5.8 percent (365 jobs). Trade, Transportation, and Utilities had the largest numerical decline, down 1,111 jobs (4.9 percent). The only supersector to add employment was Financial Activities, where employment was up by eight jobs (0.2 percent). Annually, the St. Cloud MSA added 1,412 jobs (1.3 percent). Mining, Logging, and Construction added a whopping 908 jobs (18 percent), and Educational and Health Services added 1,012 (4.8 percent) among other notable expanding supersectors. The most notable declines came in Leisure and Hospitality, which lost 548 jobs or 6.4 percent.
Employment in the Mankato-North Mankato MSA was down by 977 (1.7 percent) in January. Private sector employers lost 754 jobs (1.6 percent) while public sector jobs decreased by 223 (2.1 percent). Goods Producing supersectors lost 214 jobs (2.2 percent), and Service Providing supersectors lost 763 (1.6 percent). Annually, the Mankato-North Mankato MSA lost 153 jobs (0.3 percent). It was the only MSA in Minnesota to lose employment over the year. Goods producing supersectors actually added 39 jobs (0.4 percent), but those gains were more than erased by a loss of 192 jobs (0.4 percent) among service providing supersectors.
Employment in the Fargo-Moorhead MSA was down by 3,496 (2.4 percent) in January. Notable losses came in Mining, Logging, and Construction (down 505 or 5.8 percent) and Leisure and Hospitality (down 781 or 5.6 percent), among others. The only supersector to add jobs was Information, which grew by 100 (3.1 percent). Annually, the Fargo-Moorhead MSA added 3,440 jobs (2.5 percent). Educational and Health Services led the way with 1,485 new jobs (6.7 percent). Mining, Logging, and Construction added 314 jobs (4 percent), and Trade, Transportation, and Utilities added 503 (1.7 percent). The only supersector to contract over the year was Leisure and Hospitality, which lost 197 jobs (1.5 percent).
Employment in the Grand Forks-East Grand Forks MSA was down by 1,067 (1.8 percent) in January. Mining, Logging, and Construction lost 314 jobs (7.6 percent), while Trade, Transportation, and Utilities lost 326 (2.7 percent). The Manufacturing supersector had the largest numeric and proportional growth, adding 11 jobs or 0.3 percent. Annually, the MSA added 1,658 jobs (2.9 percent). Mining, Logging, and Construction added 998 jobs or 35.7 percent. The sharpest declines came in Information, which lost 26 jobs or 4.2 percent.
