by Ellen Bendewald
September 2014
Women, most minority racial groups, people with disabilities and residents in Greater Minnesota stand to benefit the most from a new law that will raise the state’s minimum wage to $9.50 an hour by August 2016.
DEED’s workforce development programs target economically vulnerable Minnesotans, ranging from those with persistent employment barriers to those who were recently laid off from a steady job.
Many of these Minnesotans earn a wage at or near the current legal minimum and will be affected by the stepped increase of the state’s minimum wage to $9.50 per hour1 in August 2016 at large establishments. The effects, though, could go beyond just how much people earn.
Individual workers, for instance, might decide to work a little more or a little less after receiving a raise, although hours worked generally remain fairly constant regardless of the wage rate. Employers might expect more productivity out of workers earning a higher wage, or they might raise prices of their goods and services. Although employers might also hire fewer workers in response to a higher minimum wage, previous studies are not at all clear on this. Just as many studies find increased hiring or no impact as find decreased employment because of higher minimum wages.
This article looks at how workforce development program participants in Minnesota will be affected by the minimum wage increase, breaking down the impact by worker demographics and region. While we have previously estimated that 16 percent of all jobs in Minnesota pay less than $9.50 per hour, a full 28 percent of workforce development program participants earn an hourly wage rate below that threshold.
Workforce development program policies requiring extensive demographic data collection allow for a uniquely detailed look at wage trends across worker demographics when combined with unemployment insurance (UI) wage records. This article looks at recent workforce development program participants who showed earnings within six months of receiving services, examining the most recent four quarters for which wage data are available (second quarter of 2013 through first quarter of 2014).
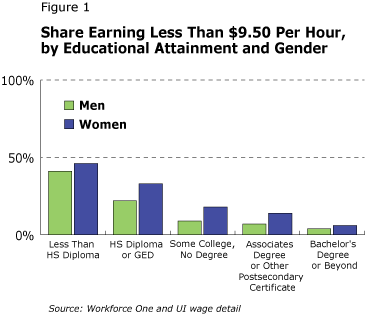
Overall, 28 percent of workforce development program participants earned less than $9.50 per hour within six months of receiving services. This overall average masks a wide range of potential effects by demographic characteristics. Most striking is education level: Nearly half (44 percent) of those without a high school diploma or GED earn less than $9.50 per hour, compared with just 5 percent of those with at least a bachelor’s degree. At every step along the education spectrum, women are more likely to earn less than $9.50 than men (see Figure 1).

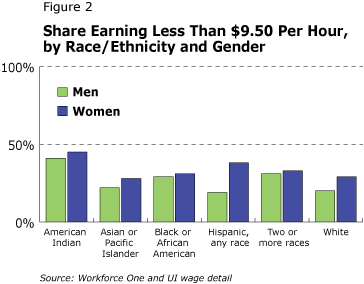
Although not as dramatic as education, race is another important lens in analyzing the potential effect of the minimum wage increase on program participants. Forty-one percent of American Indian or Alaska Native men earn less than $9.50, compared with 19 percent of Hispanic men and 20 percent of white men (see Figure 2). Within each self-identified racial and ethnic group, women are more likely to earn less than $9.50. The size of the gender gap, however, differs by racial groups: Hispanic participants show the largest gender gap (38 percent of Hispanic women earn less than $9.50, compared with 19 percent of Hispanic men). African American participants show the smallest gender gap (31 percent of African American women earn less than $9.50, compared with 29 percent of African American men).

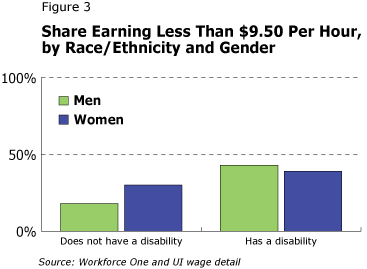
Many workforce development program participants live with a disability that affects their ability to find and retain work. (Some participants have a disability that they report does not affect their ability to work. These participants are included in the “Does not have a disability” bars.) The gender wage gap among participants with a disability is reversed: Men are slightly more likely to earn less than $9.50 per hour than women (43 percent versus 39 percent), as shown in Figure 3.

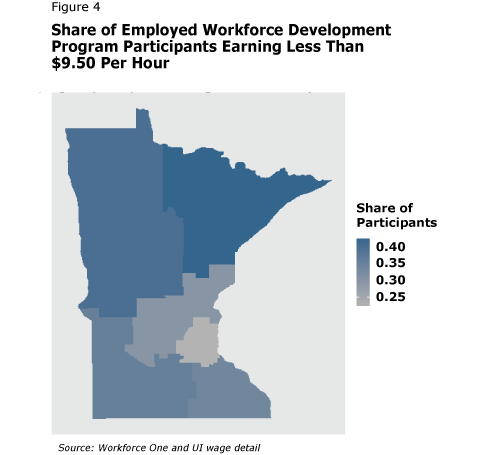
Finally, Minnesota exhibits wide regional variation in wages, with the seven-county metro region showing the lowest share (22 percent) of participants earning less than $9.50 and the Northeast Planning Region showing the highest share (42 percent), as shown in Figure 4. Additionally, at least some of the overall racial disparity is likely due to regional wage variations: More than half (55 percent) of American Indian participants in this analysis live in the Northwest Planning Region, which has among the highest rates of workers earning less than $9.50 in the state.

Based on UI wage records, a broad swath of workforce development program participants will likely see a wage boost due to the Minnesota new minimum wage statute. Starting on Aug. 1, 2014, this statute raises the minimum wage in steps over three years, with inflation adjustments thereafter. In the past year, more than one-fourth of participants have earned less than $9.50 per hour, working one or more jobs. Workforce development program participants tend to be among the most economically vulnerable, leading to a heightened importance of minimum wage laws among this population. Judging by current wages, women, most minority racial groups and those with disabilities stand to benefit the most from this wage increase.
Data and MethodologyIndividuals included in this analysis received case-managed employment services through one of the following programs: Vocational Rehabilitation Services, State Services for the Blind, employment services with the Minnesota Family Investment Program or Diversionary Work Program, employment and training services with the Supplemental Nutrition Assistance Program, the Workforce Investment Act Title 1B adult programs (including the Dislocated Worker Program) or Trade Adjustment Assistance (TAA). This analysis includes only those people found in UI wage records. People not found in UI wage records are not working, are working out of state, are self-employed or are in other non-covered employment (including railroad, work-study, family-farm and commission-only workers). Participants were asked which racial group(s) they identify with as well as whether they identify as Hispanic. In this analysis, Hispanic refers to anyone who identifies as Hispanic, regardless of race. To avoid double-counting, every other racial group excludes Hispanics. Throughout, this article focuses on people earning the minimum wage rather than jobs paying the minimum wage. For people working two or more jobs, the average wage across all jobs weighted by the number of hours worked in each job was calculated. Of 40,540 workforce development program participants who ended services within the timeframe of this analysis, 24,275 appeared in UI wage detail within six months. Employers enter both earnings and hours worked information for each employee; employment is assumed for people who have both earnings and hours. Employer-entered wage and hour data have an unknown amount of error. Hourly wage outliers, defined here as wages below $4.90 per hour (the lowest legal minimum wage) and above $90 per hour, were removed. These outliers represent 1.6 percent of the wage-earning population. |
1See Minimum Wage in Minnesota for a table with the old and new minimum wage provisions in Minnesota.