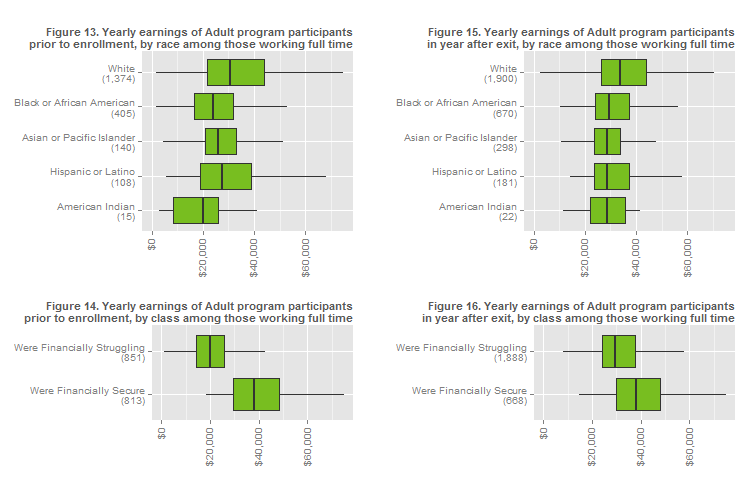
Figures 13 through 16 show the earnings distribution of Adult program participants. Each of these graphs shows earnings only among full-time workers to better isolate the earnings gap from the employment (and part-time employment) gap. Full-time employment could be one full-time, year-round job or multiple part-time or temporary jobs. Learn more about these wage boxplots in Appendix E.

Participants in the Adult programs have roughly the same pattern of wage disparity as Dislocated Worker participants, presented in Figures 9 through 12, although earnings tend to be lower among this population.
In the year prior to enrollment, white participants who work full time have the highest median earnings, at about $32,000 (Figure 13). American Indian participants who work full time have the lowest median earnings, at about $20,000. Again, the class disparity is greater: the median earnings among those who were financially secure before program participation was over $39,000, compared to about $20,000 among those who were financially struggling (Figure 14).
In the year after program exit, median earnings by race and by class show roughly the same pattern as that prior to enrollment. Median earnings among white participants working full time are nearly $35,000 in the year after participation, while earnings among every other racial group are nearly $30,000. Median earnings among those who were financially secure before program participation are almost $39,500 in the year after participation, while median earnings among those who were financially struggling are nearly $30,000 in the year after participation (Figure 16).