by Nick Dobbins
March 2019
Monthly analysis is based on unadjusted employment data.
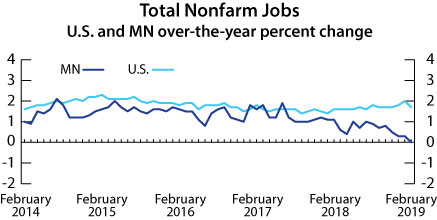
Employment in the Minneapolis-St. Paul-Bloomington MSA was off by 5,850 (0.3 percent) in February. Mining, Logging, and Construction lost 2,855 jobs (3.9 percent), Trade, Transportation, and Utilities lost 5,479 (1.5 percent), and Leisure and Hospitality lost 2,372 jobs (1.3 percent). These three largest proportional declines on the month took place in three highly seasonal supersectors, and each one underperformed compared to Februarys in recent years, suggesting our inclement weather that month may have played a role in the declines. The largest increase on the month, in both real and proportional terms, came from Government employers, which added 3,194 jobs (1.3 percent). Growth was spread among all three component groups (local, state, and federal governments). Annually the metro area lost 10,350 jobs (0.5 percent). It was the second consecutive month of over-the-year job losses in the area. Prior to January, the most recent over-the-year job loss had been July of 2010. Notable areas of negative growth included Professional and Business Services (down 5,103, 1.6 percent on the loss of 7,104 jobs in Administrative and Support and Waste Management and Remediation Services), and Educational and Health Services (down 5,423, 1.6 percent). Financial Activities employment was up by 2,002 jobs (1.4 percent).
The Duluth-Superior MSA added 254 jobs (0.2 percent) in February. Government employers did much of the heavy lifting, adding 758 jobs (2.9 percent), while Leisure and Hospitality was up 163 (1.2 percent), and Professional and Business Services was up 110 (1.4 percent). Trade, Transportation, and Utilities employment was down by 772 (3.2 percent) with losses in all three component sectors. Over the year, employment in the Duluth MSA was down by 1,140 (0.8 percent). Trade, Transportation, and Utilities lost 856 jobs (3.5 percent), Educational and Health Services lost 477 (1.4 percent), and Information lost 95 jobs (7.1 percent), among other shrinking supersectors. The largest gains came in Professional and Business Services, which added 385 jobs or 5.1 percent.
Employment in the Rochester MSA was down by 252 (0.2 percent) in February. Trade, Transportation, and Utilities lost 232 jobs (1.3 percent), most of that from Retail Trade (off by 220 or 1.8 percent), and Leisure and Hospitality lost 146 jobs (1.3 percent). Professional and Business Services added 109 jobs or 1.8 percent, the largest real and proportional gains in the MSA. Over the year the Rochester area added 1,825 jobs (1.5 percent). It was the largest over-the-year employment growth of any MSA listed here. The growth was driven by a number of supersectors, including Manufacturing (up 557 or 5.4 percent), Mining, Logging, and Construction (up 290, 7.4 percent), and Leisure and Hospitality (up 342, 3.3 percent). Only two supersectors (Information and Financial Activities) lost jobs on the year.
Employment in the Saint Cloud MSA was up by 777 (0.7 percent) in February. Government employers added 427 jobs (2.8 percent) with growth in all three levels of government, and Educational and Health Services added 230 jobs (1 percent). The biggest actual job loss came in Manufacturing, which shed 71 jobs (0.5 percent). Annually the area added 1,365 jobs (1.3 percent). Mining, Logging, and Construction was the engine that drove the area’s labor market, adding 1,013 jobs (19.2 percent) on the year, far outpacing every other supersector’s real or proportional growth. The Information supersector’s employment was off by 9.6 percent or 137 jobs.
The Mankato-North Mankato MSA added 184 jobs (0.3 percent) in February. The gains came entirely from government employers (up 252 or 2.6 percent) as private sector employers lost 68 jobs (0.1 percent). Service providers added 429 jobs (0.9 percent), and goods producers lost 245 (2.4 percent). On the year, employment in the Mankato-North Mankato MSA was mostly flat, as the area added just 16 jobs (0 percent). Government employers added 203 jobs (2.1 percent), but private sector employers lost 187 jobs (0.4 percent).
The Fargo-Moorhead MSA added 1,407 jobs (1 percent) in February. It was the largest proportional over-the-month growth of any MSA published by the state. Government employers added 967 jobs (5.1 percent), Professional and Business Services added 398 (2.7 percent), and Educational and Health Services added 272 (1.1 percent). Annually the Fargo-Moorhead area lost 349 jobs (0.3 percent). Leisure and Hospitality shed 648 jobs (4.7 percent), and Trade, Transportation, and Utilities lost 503 (1.7 percent). Educational and Health Services added 630 jobs (2.6 percent).
The Grand Forks-East Grand Forks MSA lost 232 jobs (0.4 percent) in February. Trade, Transportation, and Utilities employment was down by 159 (1.4 percent), and Leisure and Hospitality employment was off by 183 (3.1 percent). Annually the supersector lost 1,010 jobs or 1.8 percent. It was the largest over-the-year decline of any published MSA in the state. The loss was driven by declines in Government (off 478 or 3.3 percent), Trade, Transportation, and Utilities (down 459, 4.1 percent), and Leisure and Hospitality (430, 6.9 percent). Financial Activities added 110 jobs or 5.7 percent.
