by Carson Gorecki
July 2020
Women, people of color, and younger workers have all applied for unemployment benefits at higher rates across the country, state, and here in Northeast Minnesota than in the past, reflecting the different impact of this recession. As businesses re-open or ramp-up operations, these and other workers will likely face differing challenges. Some of these challenges will depend on the type of work sought. Occupations, specifically those that are unable to accommodate work from home and/or require work in close proximity to customers or coworkers, will require additional consideration.
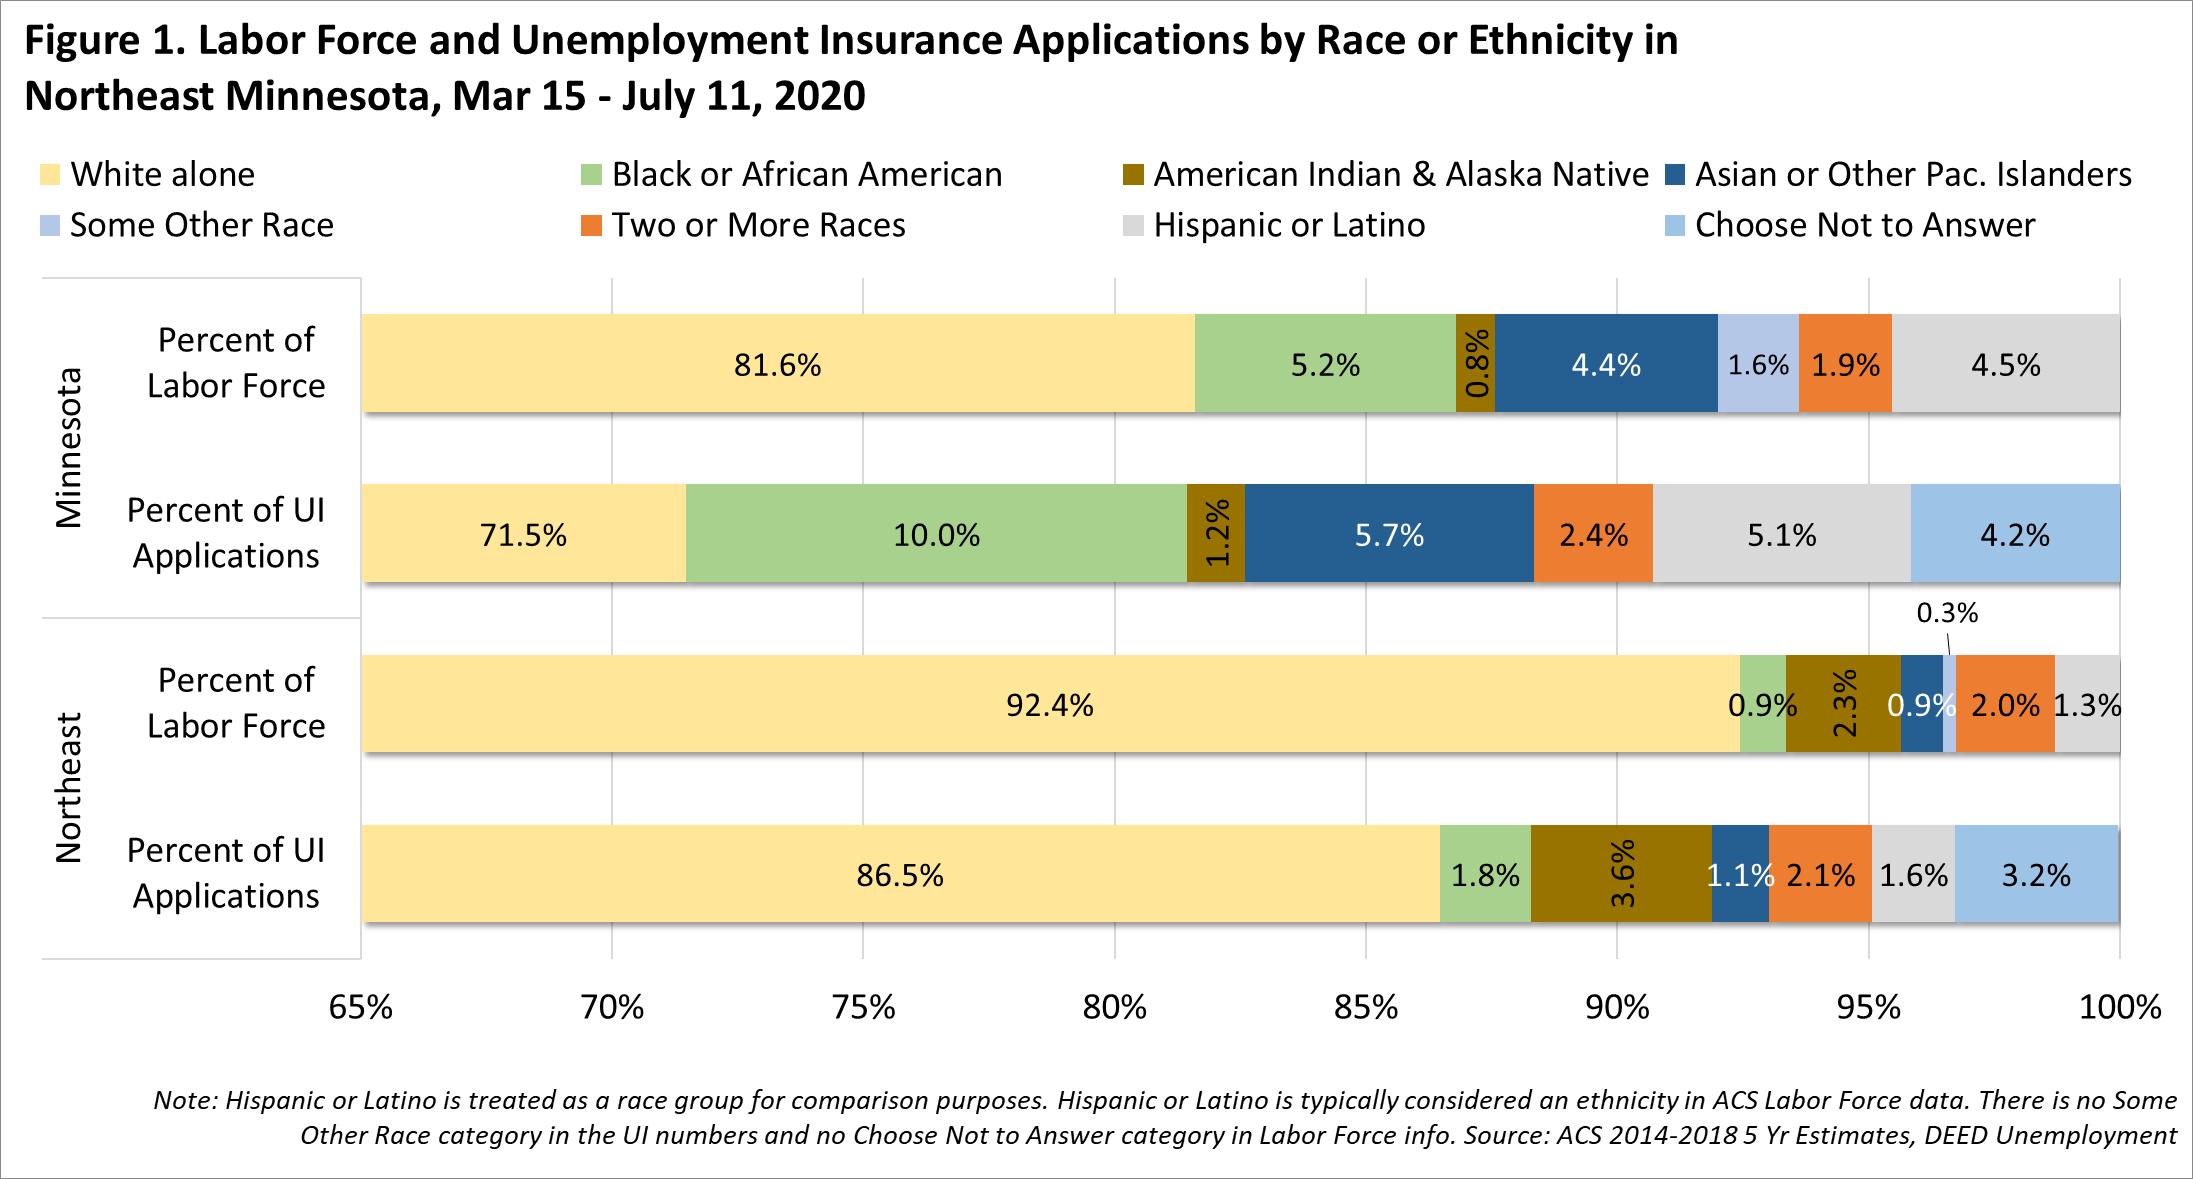
Initial unemployment insurance (UI) applications indicate disproportionate impacts of the pandemic on certain segments of the regional workforce. Nowhere is this clearer than when applications are broken down by race and ethnicity. Even with a less diverse workforce, the disparities in Northeast Minnesota are evident. Black, Indigenous, and People of Color (BIPOC) have applied for unemployment at higher rates than they exist in the labor force. Black or African Americans, while accounting for less than 1% of the labor force, represented double that share in unemployment claims. Similarly, American Indians and Alaska Natives made up 2.3% of the labor force and 3.7% of UI claims (see Figure 1).

Even though the share of UI claims during the pandemic is nearly equal by gender, compared to historical claims there is a clear difference. Historically, men have nearly three times as many UI claims in Northeast. Compared to 2009 and 2019, the share of claims filed by women has almost doubled (see Table 1). Women make up 47% of the Northeast labor force, showing the disproportionate impact the pandemic has had on different workers.
| Table 1. Initial UI Claims by Gender in Northeast Minnesota, Mar - Jun 2009, 2019, and 2020 | |||
|---|---|---|---|
| 2009 | 2019 | 2020 | |
| Male | 73.7% | 70.8% | 48.7% |
| Female | 26.3% | 29.2% | 51.3% |
| Source: DEED Unemployment Insurance Statistics | |||
The unprecedented numbers of layoffs are well-documented. As our economy starts to recover, identifying sectors that lag or are more successful will be crucial in allocating very limited resources effectively. The number of UI applications are good indicators of which occupations, industries, and demographic groups saw the most layoffs. Applications however, do not show which workers are staying unemployed for longer periods – an important piece of the puzzle in assessing impacts across groups. Regular continued UI claims indicate repeated claims over multiple weeks and provide a clearer look at longer term unemployment.
Data from DEED's Unemployment Insurance Statistics Data Tool show how applications peaked at the end of March and beginning of April, but then declined week over week through July 4, before a slight uptick the week ending July 11. The weekly high of 6,615 UI applications in the region occurred the week immediately following the March 13 stay at home order. By comparison, the week ending July 11 saw 858 initial claims.
Although there are fewer people applying for unemployment for the first time at this point in the pandemic, many applicants continue to request benefits over multiple weeks. Regular continued claims, which are available by month rather than on a daily or weekly basis, peaked in April at 24,705 and showed smaller declines into May. There were 19,489 continued UI claims in June.
Regular continued claims rose from April to May in Itasca and Lake counties and fell only 3.3% in St. Louis County. June saw larger drops in the number of continued claims across the region. Aitkin and Cook counties saw the largest relative drops while Koochiching saw the smallest. Despite the variation across the region's counties, all had larger relative decreases in claims compared to the state. A decline in continued claims is most likely a positive sign of claimants returning to work but may also include those who exhausted benefits or stopped looking for work (see Table 2).
| Table 2. Regular Continued Unemployment Claims by County, Northeast Minnesota | |||||
|---|---|---|---|---|---|
| Area | March | April | May | June | Percent Change
May - June |
| Aitkin | 374 | 1,104 | 929 | 710 | -23.6% |
| Carlton | 539 | 2,731 | 2,432 | 1,996 | -17.9% |
| Cook | 88 | 669 | 569 | 429 | -24.6% |
| Itasca | 913 | 3,267 | 3,237 | 2,658 | -17.9% |
| Koochiching | 238 | 766 | 633 | 523 | -17.4% |
| Lake | 131 | 801 | 889 | 724 | -18.6% |
| St. Louis | 2,544 | 15,367 | 15,203 | 12,449 | -18.1% |
| Northeast Region | 4,827 | 24,705 | 23,892 | 19,489 | -18.4% |
| Minnesota | 70,118 | 399,767 | 395,180 | 333,555 | -15.6% |
| Source: MN DEED Unemployment Insurance Statistics | |||||
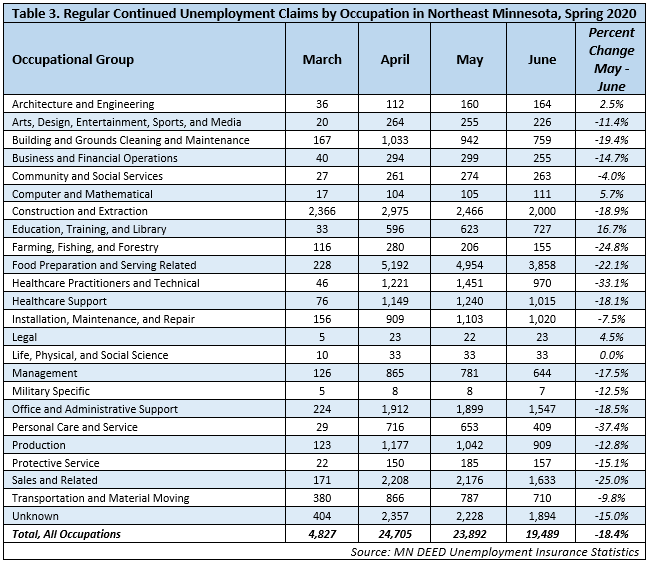
The industrial and occupational mix of an area or region will play an important role in determining the relative impacts of the pandemic. Of the occupational groups with the most claims, both healthcare support and healthcare practitioners and technical saw increases in the number of continued claims from April into May. On the other hand, sales and related, food preparation and serving related, office and administrative support, and construction and extraction saw slight declines (see Table 3).
Food preparation and serving related occupations, the group with the greatest number of claims, saw only a 4.6% decline from April to May. Sales and related occupations fell only 1.4% and office and administrative support dropped a minimal .6%.

Continued claims fell for most occupational groups from May to June, with a notable exception in education, training, and library which added over 100 claims. The largest drops were in personal care (-37.4%), healthcare practitioners (-33.1%), and sales and related (-25.0%), three occupational groups that saw large numbers of claims early in the pandemic. Farming, fishing, and forestry and food preparation and serving related also saw claims decline by more than 20%.
The seasonal nature of construction and extraction occupations meant relatively high numbers of continued claims even in March. In addition, pandemic-induced effects and uncertainty likely slowed typical spring hiring in construction. The large number of mining layoffs is spread across several occupational groups but are most likely to be concentrated in construction and extraction and installation, maintenance, and repair occupations, which all saw claims increase from April to May and then decrease from May to June.
The decline of continued claims across most occupations is a positive sign. Not all occupations, however, face the same path to recovery, and the nature of some jobs will require additional care and creativity in order to keep workers safe.
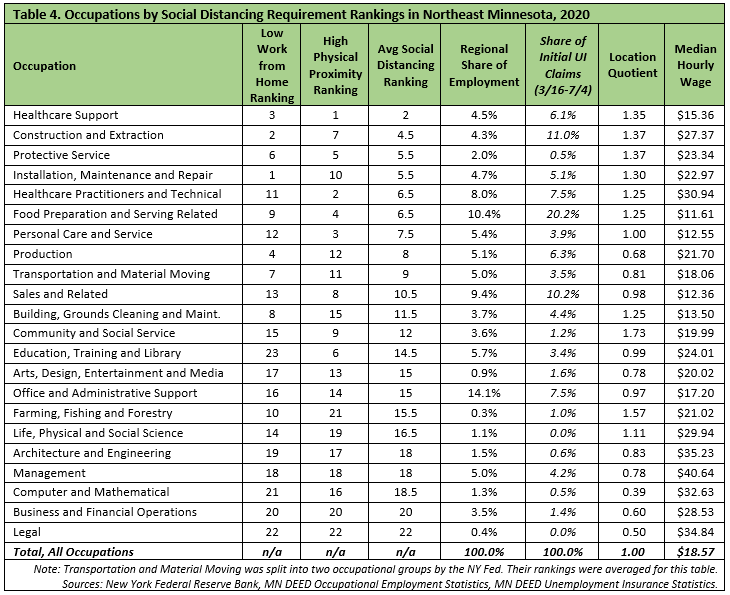
People whose jobs require them to work on-site and/or require them to be physically close to customers are more impacted both by fewer jobs coming back because of social distancing restrictions, but also by the potential risk of exposure to the virus that causes COVID-19. To give insight on hos this will impact workers, the Federal Reserve Bank of New York ranked all the major occupational groups based on information from a survey of workers. On their social distancing rankings, the higher the physical proximity score and the lower the work from home score, the greater the impact on a person's employment. Those jobs that depend on interpersonal interaction, such as patient-centric health care occupations, have high rankings in the physical proximity (PP) score. Meanwhile, jobs that require workers to be on-location such as construction and installation, maintenance and repair, have correspondingly low work from home (WFH) rankings.
By applying the New York Fed's social distancing rankings to Northeast Minnesota's occupation mix, we see some predictable trends, but can also glean some more nuanced observations. Office and administrative support occupations, for example, have low WFH and PP scores. These occupations also have a relatively low share of UI claims compared to their share of overall employment, indicating avoidance of some of the worst effects from the pandemic. Similarly, legal and business and financial operations occupations had low social distancing rankings, as much of the work can be accomplished remotely and without the need for physical contact. In this case the lower rankings correlate with a relatively small share of UI claims.
On the other end of the spectrum, healthcare support had the highest combined social distancing scores. And while healthcare support occupations had a higher relative share of UI claims, it was not as high as food preparation and serving related which had lower social distancing scores, but a larger total count of UI claims. Construction and extraction occupations also ranked high in both social distancing categories, particularly in the work from home ranking as most construction work has to be done on site (see Table 4).

Perhaps of most significance to the region, many of the occupations with high physical proximity scores are more concentrated in Northeast Minnesota when compared to the state. The location quotients for healthcare, construction, food preparation, and installation, maintenance and repair occupations are all greater than 1.0, indicating higher than average concentration. Each of these occupations also has at least one top-five social distancing ranking. Northeast Minnesota, as a result, will likely have to work harder than other parts of the state to manage the continuing social distancing requirements, particularly within hard-hit occupations and industries such as healthcare, construction, and food preparation and serving.
Food preparation and serving and healthcare practitioners and technical occupations had the same average social distancing scores and employment concentration, yet the latter has fared relatively better with a smaller share of UI claims. One of the factors that is not accounted for in this social distancing rules analysis is the essential vs. nonessential distinction. A much larger portion of healthcare jobs were labeled essential and therefore provided a measure of protection that did not extend to most food preparation and serving occupations.
Lastly, as the school year approaches, state and local leaders are debating whether to re-open schools to in-person classes. Education, training, and library occupations were given the lowest possible work from home score, but a relatively high physical proximity score, indicating both opportunities and challenges ahead. The increase in continued UI claims for education occupations seems to reflect this uncertainty.
The initial avalanche of unemployment applications appears to have subsided, yet an imminent and consistent recovery is not assured. Even as certain segments of the economy begin to show improvement, not all are reaping the benefits. Workers of color and women continue to apply for unemployment at disproportionate levels. Those jobs less easily conducted from home as well as those necessitating close physical proximity will face additional challenges that will require creativity, flexibility, and resourcefulness on the part of all parties in order to get employees and businesses back to work.