by Mark Schlutz
June 2019
Creative hiring incentives counter regional reductions in the labor force and unemployment rate.
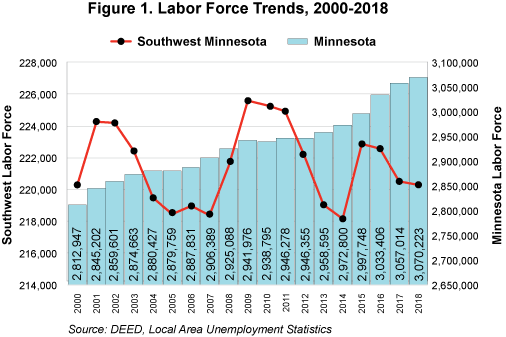
While Minnesota has enjoyed a steady increase in labor force participants year after year, the Southwest planning region has not been as fortunate, experiencing ebbs and flows since 2000. In fact, there have been three periods during this time in which the regional labor force saw dramatic decreases, including a drop of almost 6,000 available workers from 2001 to 2007. As the Great Recession set in, workers flooded back into the labor market, reaching a new peak of 225,616 workers in 2009.
As the economy began to recover, the region again saw declines from 2009 to 2014, losing over 7,450 participants, to a new low of 218,153 workers. Southwest then saw a one-year jump of more than 4,700 additional workers, followed by another series of losses over the next three years. At the end of the roller coaster ride, the net result was an increase of only 51 labor force participants between 2000 to 2018, but a decrease of almost 5,300 workers since the peak in 2009 (Figure 1).

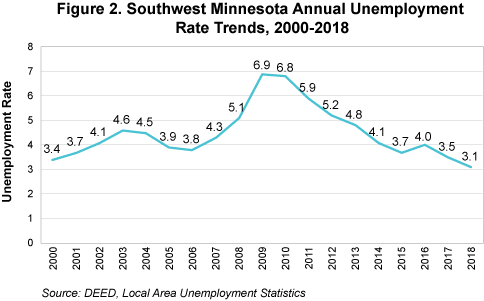
The region's unemployment rate has seen somewhat similar ebbs and flows, also peaking in 2009 before seeing a fairly steady decline through 2018. Going back to 2000, the unemployment rate in Southwest has decreased by 0.3 percent, indicating a healthy economy and a tight labor market. Since its peak in 2009, the rate dropped from 6.9 to 3.1 percent (Figure 2).

These reductions in the labor force and unemployment rate have led to a troublesome reality in which the job seeker-per-vacancy ratio has dropped to 0.6-to-1. That means that for every 10 job openings, only six unemployed people were actively seeking work. As a result of this imbalance, many companies are struggling to fill their job vacancies, prompting some employers to adopt hiring and retention incentives such as higher starting wages, hiring bonuses, educational reimbursement, or flexible scheduling.
Despite the labor market fluctuations, Southwest saw growth of over 4,100 jobs from 2009 to 2018, a 2.4 percent jump. The largest numeric increases were in health care and social assistance, up 1,318; transportation and warehousing, up 1,210; and agriculture, forestry, fishing and hunting, up 1,052 jobs. The fastest growing industry sectors included agriculture, forestry, fishing and hunting, up 24.6 percent; transportation and warehousing, up 20.5 percent; and real estate, rental and leasing, up 17.1 percent. Unfortunately, seven industry sectors lost jobs during this period, including over 500 jobs lost in accommodation and food services and almost 490 fewer jobs in management of companies and enterprises (Table 1).
| Table 1. Southwest Minnesota Industry Employment | |||||||
|---|---|---|---|---|---|---|---|
| Industry Sector | 2009 to 2018 | 2018 Annual Average | |||||
| 2009 Jobs | 2018 Jobs | Numeric Change in Jobs | Percent Change in Jobs | 2018 Establishments | 2018 Total Payroll | 2018 Average Annual Wage | |
| Total, All Industries | 172,617 | 176,790 | 4,173 | 2.4% | 12,308 | $7,382,049,343 | $41,704 |
| Health Care and Social Assistance | 29,987 | 31,305 | 1,318 | 4.4% | 1,272 | $1,296,435,868 | $41,392 |
| Manufacturing | 31,293 | 31,135 | -158 | -0.5% | 602 | $1,610,843,866 | $51,740 |
| Retail Trade | 19,848 | 19,877 | 29 | 0.1% | 1,520 | $485,979,390 | $24,440 |
| Educational Services | 15,477 | 16,278 | 801 | 5.2% | 240 | $682,060,526 | $42,224 |
| Accommodation and Food Services | 12,620 | 12,072 | -548 | -4.3% | 868 | $165,352,210 | $13,676 |
| Public Administration | 9,805 | 10,036 | 231 | 2.4% | 588 | $438,109,795 | $43,680 |
| Construction | 7,444 | 8,181 | 737 | 9.9% | 1,530 | $431,286,361 | $52,416 |
| Wholesale Trade | 8,099 | 7,939 | -160 | -2.0% | 651 | $466,179,322 | $58,656 |
| Transportation and Warehousing | 5,894 | 7,104 | 1,210 | 20.5% | 750 | $271,467,603 | $38,168 |
| Finance and Insurance | 5,776 | 6,003 | 227 | 3.9% | 720 | $369,941,791 | $61,620 |
| Agriculture, Forestry, Fishing, and Hunting | 4,274 | 5,326 | 1,052 | 24.6% | 657 | $229,727,310 | $43,004 |
| Other Services (except Public Administration) | 5,078 | 4,919 | -159 | -3.1% | 1,039 | $144,348,623 | $29,328 |
| Professional, Scientific, and Technical Services | 3,757 | 3,967 | 210 | 5.6% | 605 | $226,850,812 | $57,200 |
| Admin. and Support and Waste Mgmt. and Remediation | 3,873 | 3,923 | 50 | 1.3% | 383 | $135,429,701 | $34,476 |
| Information | 3,012 | ,2624 | -388 | -12.9% | 214 | $127,538,523 | $48,620 |
| Arts, Entertainment, and Recreation | 1,946 | 1,963 | 17 | 0.9% | 236 | $32,874,494 | $16,744 |
| Real Estate and Rental and Leasing | 1,221 | 1,430 | 209 | 17.1% | 285 | $39,922,699 | $27,872 |
| Management of Companies and Enterprises | 1,894 | 1,408 | -486 | -25.7% | 48 | $116,952,525 | $82,940 |
| Utilities | 1,008 | 960 | -48 | -4.8% | 80 | $86,737,341 | $90,376 |
| Mining | 307 | 337 | 30 | 9.8% | 25 | $24,010,583 | $72,228 |
| Source: DEED Quarterly Census of Employment and Wages | |||||||
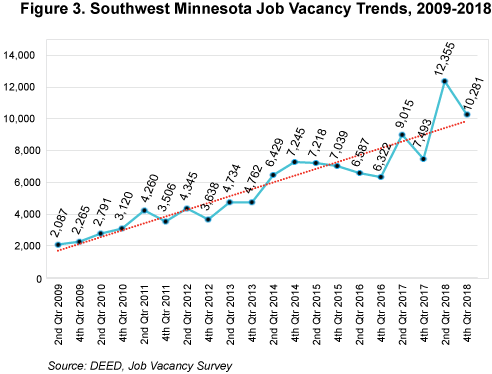
Despite some peaks and valleys, the number of job vacancies in the Southwest region has increased as well, jumping from just over 2,000 openings during 2009 to well over 10,000 vacancies in 2018, an increase of more than 400 percent. The largest number of vacancies ever reported in the region dating back to 2001, at 12,355 openings, occurred during the second quarter of 2018 (Figure 3).

Beyond flat population growth and low unemployment, certain characteristics of the region's job vacancies may make it even more difficult for some employers to fill their jobs as well. For example, three of the five largest occupational groups in demand offer predominantly part-time jobs, and 40 percent of all openings are part-time. Many of these part-time openings do not offer benefits such as health care, and many offer low wages, resulting in compensation that is inadequate to meet the region's basic cost-of-living.
On the other end, a smaller group of vacancies are characterized by high education or experience requirements and higher wages. For example, 95 percent or more openings in education, training and library, health care practitioners, and management occupations require post-secondary education and 95 percent or more vacancies in management and business and financial operations occupations require one or more years of experience (Table 2). Not surprisingly, the median wage offers for these openings are significantly higher than those that don't require education and experience. However, higher wages may not make these jobs easier to fill if qualified workers do not live in the area.
Fewer people are out there looking for work, meaning the combination of a low job seeker-per-vacancy ratio and some challenging job characteristics are making it more difficult for employers to fill their vacancies.
| Table 2. Southwest Minnesota Job Vacancies, 4th Qtr. 2018 | ||||||
|---|---|---|---|---|---|---|
| Occupational Group | Number of Job Vacancies | Percent of Total Vacancies | Percent Part-Time | Percent Requiring Post-Secondary Education | Percent Requiring 1+ Years Experience | Median Wage Offer |
| Total, All Occupations | 10,281 | 100.0% | 40% | 28% | 30% | $13.63 |
| Personal Care and Service | 1,326 | 12.9% | 76% | 6% | 3% | $11.98 |
| Food Preparation and Serving Related | 1,300 | 12.6% | 59% | 14% | 14% | $10.95 |
| Production | 996 | 9.7% | 6% | 9% | 18% | $14.00 |
| Transportation and Material Moving | 911 | 8.9% | 28% | 9% | 61% | $19.22 |
| Protective Service | 817 | 7.9% | 99% | 1% | 2% | $9.98 |
| Healthcare Practitioners and Technical | 790 | 7.7% | 41% | 96% | 43% | $22.70 |
| Building/Grounds Cleaning and Maintenance | 611 | 5.9% | 14% | 3% | 7% | $12.43 |
| Sales and Related | 608 | 5.9% | 39% | 42% | 41% | $13.73 |
| Installation, Maintenance, and Repair | 421 | 4.1% | 4% | 50% | 75% | $17.92 |
| Office and Administrative Support | 376 | 3.7% | 30% | 18% | 47% | $14.01 |
| Construction and Extraction | 323 | 3.1% | 1% | 13% | 14% | $16.52 |
| Healthcare Support | 296 | 2.9% | 51% | 24% | 2% | $12.76 |
| Education, Training, and Library | 281 | 2.7% | 51% | 98% | 79% | $14.28 |
| Farming, Fishing, and Forestry | 281 | 2.7% | 50% | 10% | 5% | $13.40 |
| Life, Physical, and Social Science | 227 | 2.2% | 0% | 36% | 40% | $14.92 |
| Management | 202 | 2.0% | 0% | 95% | 99% | $28.66 |
| Business and Financial Operations | 155 | 1.5% | 3% | 77% | 96% | $26.08 |
| Architecture and Engineering | 151 | 1.5% | 2% | 73% | 79% | $24.23 |
| Community and Social Service | 80 | 0.8% | 20% | 57% | 81% | $19.32 |
| Computer and Mathematical | 70 | 0.7% | 23% | 81% | 76% | $26.47 |
| Arts, Design, Entertainment, Sports, and Media | 19 | 0.2% | 9% | 90% | 74% | $18.48 |
| Source: DEED Job Vacancy Survey | ||||||