by Carson Gorecki
July 2021
The economic roller coaster that was the last 15 months saw a drastic spike in unemployment coupled with a significant decline in the labor force. Separately each of these trends represent differing and evolving pandemic impacts while combined they contributed to an unparalleled contraction of the workforce, both nationally and here in Northeast Minnesota.
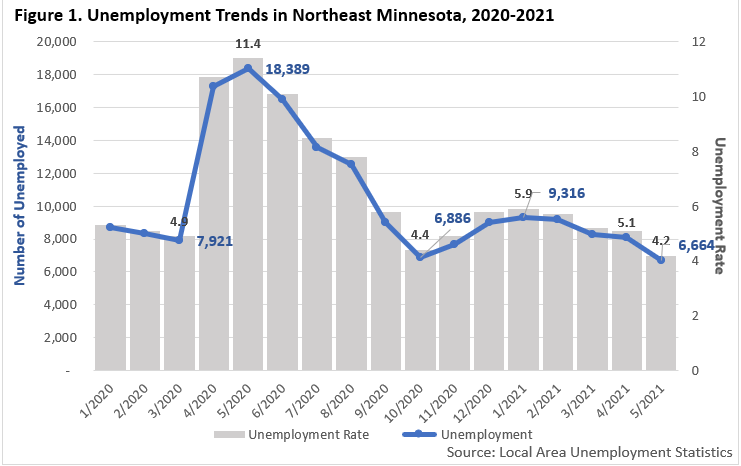
The unemployment rate in Northeast Minnesota planning region reached as high as 11.4%, and the number of unemployed peaked at 18,389 in May of 2020. Since that point, the unemployment rate fell somewhat rapidly to a rate of 4.4% in October, before rising again with the rising number of cases in the winter months. In recent months the unemployment rate declined again from 5.9% in January to 4.2% in May (see Figure 1). The rate and number of unemployed in May were both the lowest since October 2019 and were both below the May average from 2015-2019. Yet the general decline in unemployment masks the relative rise of the long-term unemployed.
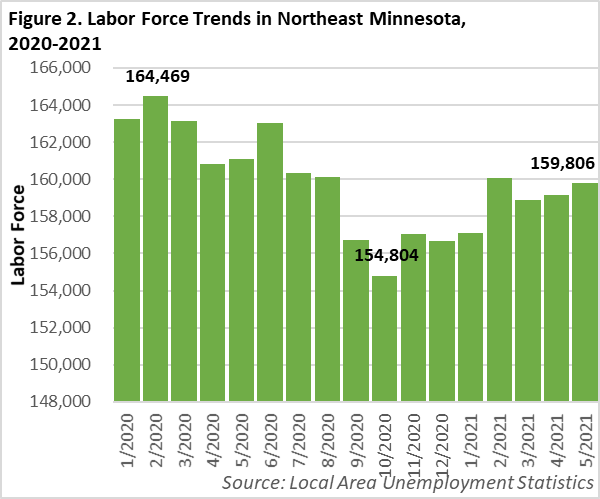
The other trend that has contributed to the decline of the workforce in Northeast Minnesota over the past year is people leaving the labor force. These are workers who decided to stop looking for work altogether. Compared to February 2020 there were 4,663 or 2.8% fewer people in the labor force in May 2021. At one point last fall the labor force was nearly 9,700 workers smaller than before the pandemic (see Figure 2). While the labor force has started to expand again over the past several months, the region still has a way to go to reach pre-pandemic numbers.
 The trend of labor force decline is not new to Northeast Minnesota. In the 1990s the labor force grew by an average of nearly 2,000 workers each year. In the 2000s labor force growth began to slow. Since 2010 average growth flipped to an average loss of 151 workers (not including 2020) that was accelerated to an annual loss of 664 workers by the pandemic (see Table 1).
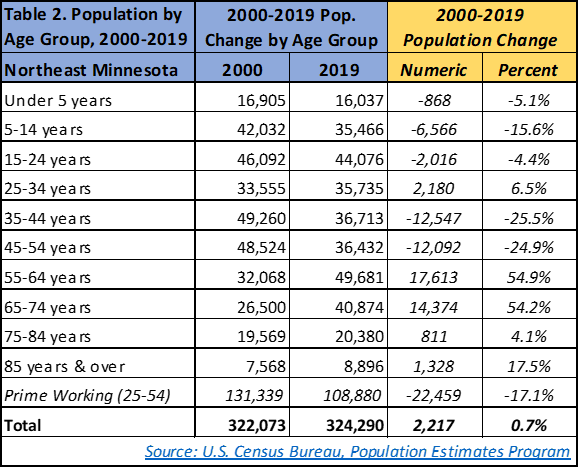
The longer-term plateauing and decline of the labor force are also reflections of larger population trends in the region. Since 2000 the labor force declined 2.8% while the total population grew by only 0.7%. Additionally, most of the population growth occurred in residents over the age of 55, which is typically the age when labor force participation starts to decline. The prime working age population (ages 25-54) fell more than 17% and the existing younger generations that would typically replenish the supply of potential workers have also declined over the last two decades (see Table 2). The universe of potential workers in Northeast Minnesota appears no longer to be growing.
There are many different and overlapping reasons why workers may have opted out of the labor force. First could be fear of the virus or concern about exposing vulnerable family members. Second, with unpredictable school schedules and childcare, some parents may have done the math and decided staying home was the best for their families. Next, multi-worker households may have adjusted during the pandemic and discovered that they could make it work on one paycheck after all. Lastly, there are all the typical reasons that occurred prior to the pandemic. Workers become discouraged after months of unsuccessful job searching or would work if the right job was available. Whatever the reason(s), more workers decided to halt job-searching. Whether those workers permanently left the labor force or the decision was temporary is crucial to the recovery but remains to be seen.
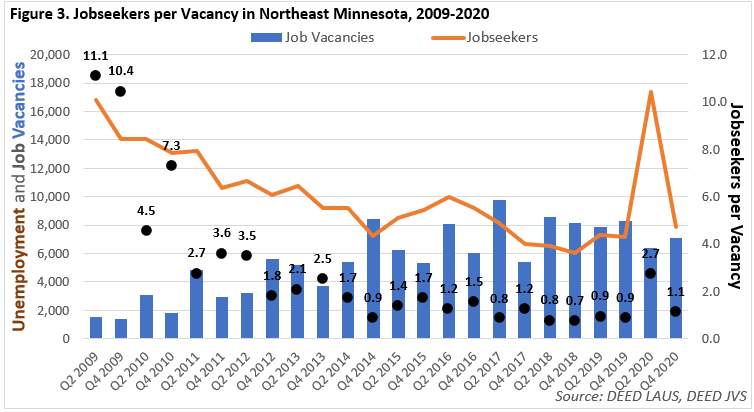
The recent modest increases in the labor force combined with the decrease in the number of unemployed is reason for optimism in the region’s recovery from the pandemic. Both the unemployment rate and the number of unemployed in May were the lowest they have been in over a year. Yet, the overall unemployment trend is not telling the entire story. Earlier in this article and in previous blogs I discussed how the decline in the labor force since the pandemic began is cause for concern. The tight labor market conditions that existed prior to the onset of COVID-19 are returning, and now the pool of workers employers must hire from is about 4,700 smaller than it was more than a year ago. At 1.1, the number of jobseekers per job vacancy was nearing pre-pandemic levels as early as the end of 2020 (see Figure 3).
The unemployment story itself is more nuanced than the simple trends of falling numbers and rates. The typical measure of unemployment, also known as the U-3 rate, is most widely used and is the unemployment rate referenced earlier in this article. Those counted under the U-3 rate were not employed in the previous week and had looked for work at some point in the past four weeks. The U-3 rate does not include people that want a job but are not actively searching because they became discouraged. The U-3 rate also does not include marginally attached people, or folks that looked for work at some point in the last year but have not looked in the last month. Lastly, the typical U-3 unemployment rate does not include those workers working fewer than 35 hours a week who would like to work full time. These alternative measures of unemployment, referred to as the U-4, U-5, and U-6 rates respectively, have increased at a rate exceeding that of the U-3 rate over the past year.
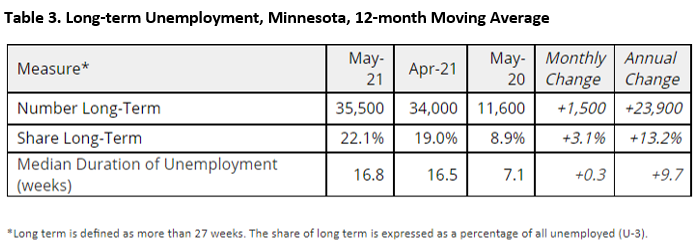
In addition, the state tracks long-term unemployment, defined as more than 27 weeks. Statewide, both the number and share of long-term unemployed rose over the month and year (see Table 3). Accordingly, the median duration of unemployment has also increased, more than doubling over the year.
The alternative measures of unemployment and long-term unemployment figures are unavailable below the state level. DEED’s unemployment insurance (UI) statistics however, allow for a more detailed and local look at unemployment dynamics as the economy strives to recover. In addition to the regular continued and extended continued programs that the state typically provides, the federal response to the pandemic provided the Pandemic Unemployment Assistance (PUA) and Pandemic Emergency Unemployment Compensation (PEUC) programs. The PUA program made UI benefits available to thousands of workers who were not typically eligible, including the self employed and independent contractors. The PEUC program provided an extension to those who exhausted regular state benefits, typically after 26 weeks. The PUA program served to supplement the state regular continued claims as the PEUC program supplemented the existing extended continued claims.
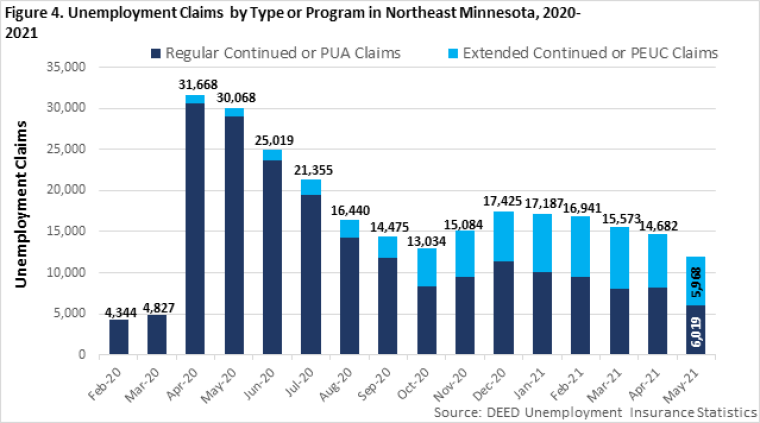
Total UI claims1, like the unemployment and the number of unemployed, have declined considerably since April and May of last year. After reaching a high of nearly 32,000, total continued claims sat at just under 12,000 in May. This is where additional nuance is both available and important. While both regular continued or PUA claims have declined since December 2020 and extended continued or PEUC claims have declined since March, the share of extended or PEUC claims has increased in all but one month since March 2020. In April 2020 the share of extended continued or PEUC claims was 3.4%. As of May, claims were effectively split evenly between regular/PUA and extended/PEUC for the first time, indicating a relative rise in long term unemployment as more claimants exhaust their regular benefits and transition to extended benefits programs (see Figure 4). Statewide, the share of extended/PEUC followed a similar trend of growth and sat at a slightly lower 48% in May, compared to Northeast Minnesota.
The transition from regular to extended unemployment benefits represents an important shift in the economic recovery. The long-term unemployed are less likely to re-enter the workforce easily because of the stigma which in turn can feed a cycle of anxiety and decline of confidence. This can be particularly true for older workers and workers with higher educational attainment or unique experience. As a result, the long-term unemployed have been a traditionally underutilized resource, one that is extremely valuable in a tight labor market such as the one we currently find ourselves in.
In Northeast Minnesota the share of long-term unemployment as calculated from unemployment claims data was, as of May 2021, higher than the state average. One possible explanation for this is the makeup of the regional labor force which is older than the state average. Research by DEED’s Alessia Leibert shows that older workers filing unemployment claims last spring and summer were less likely to be reemployed and faced higher barriers to taking new jobs in different industries. During the recovery from the pandemic recession, efforts to reach the long-term unemployed, eliminate barriers, and welcome them back into the workforce should be one of many strategies utilized by employers and the workforce development community.
1Unemployment claims differ from the number of unemployed. Those filing claims may still be considered employed if they continue to work a second job or only saw their hours decline. Additionally, those considered to be unemployed may not be filing or receiving unemployment claims.