by Dave Senf
May 2017
Note: All data except for Minnesota’s PMI have been seasonally adjusted. See the feature article in the Minnesota Employment Review, May 2010, for more information on the Minnesota Index.
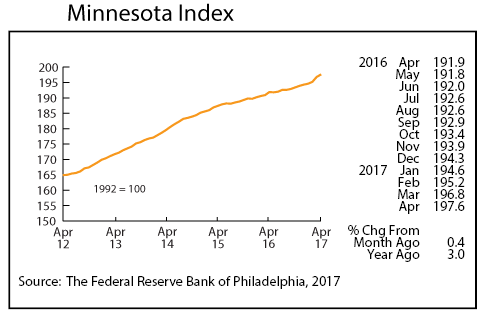
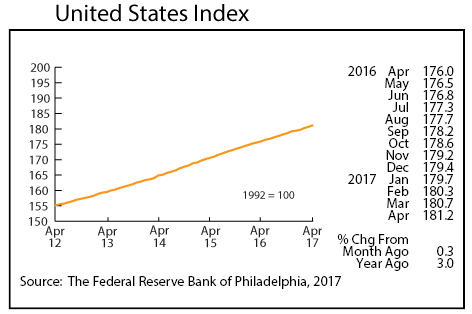
The Minnesota Index, after surging by 0.8 percent in March, recorded another month of strong growth, climbing 0.4 percent in April. The two-month 1.2 percent advance was the largest since late 2011. The Minnesota Index has averaged 0.2 percent increase monthly since 1979. The index is designed to be a monthly proxy for the state’s gross domestic product (GDP). Increasing nonfarm wage and salary employment and higher average weekly manufacturing hours fueled April’s advance. The U.S. index moved 0.3 percent higher in April.
Minnesota’s index is up 3.0 percent over the year, matching U.S. growth over the same period. The index has averaged 2.7 percent over-the-year growth during the last four decades, slightly higher than the 2.5 percent national average.
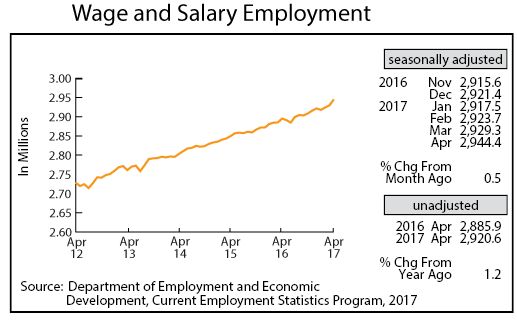
Minnesota’s adjusted Wage and Salary Employment was up 0.5 percent in April as the state’s employers added 15,100 workers. The private sector added 12,100 jobs while the public sector increased payroll numbers by 3,000. Hiring was highest in Educational and Health Services, Construction, Government, and Professional and Business Services. Job loss was confined to Mining and Logging, Financial Actives, and Trade, Transportation, and Utilities. Job cutbacks were small in those supersectors.
Manufacturing recorded job growth for the third consecutive month, something the sector hasn’t done since early 2015. Construction employment had its second robust hiring month over the last three months, adding 3,600 workers. Total construction employment is now only 5.4 percent below the all-time high reached in February 2006. Minnesota’s unadjusted over-the-year job growth fell from 1.7 percent last month to 1.2 percent in April. The national rate also dropped, decreasing from 1.5 to 1.4 percent.
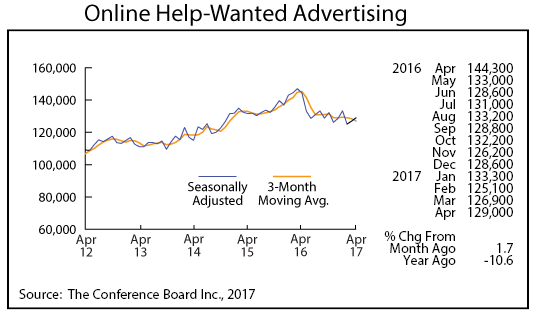
Online Help-Wanted Ads edged up for the second straight month to 129,000 in April. Minnesota’s online job postings increased 1.7 percent while nationwide postings dipped 0.6 percent. Minnesota online job ads accounted for 2.7 percent of online U.S. job ads, the highest percent on record. Minnesota’s job growth should keep pace with U.S. job growth if online help-wanted ads are a reliable proxy for labor demand and if Minnesota employers can find enough workers to hire.
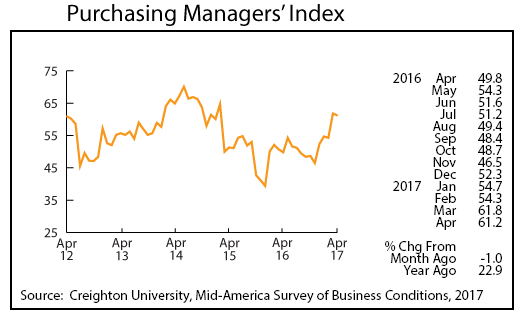
Minnesota’s Purchasing Managers’ Index (PMI) slipped slightly in April to a still robust 61.2. April’s reading is the second highest over the last two years. The strong reading indicates that Minnesota’s manufacturers will continue to ramp up production over the next few months. The corresponding national index dipped to 54.8 while the Mid-American index rose to 61.4. The employment component of the index continued to run positive, topping 60 for the second month in a row.
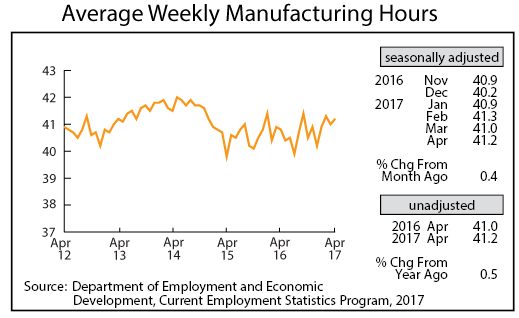
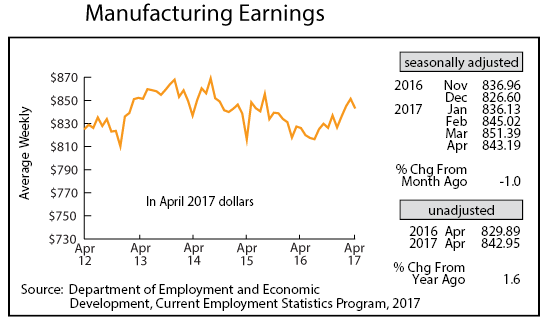
Adjusted Manufacturing Hours, however, zigzagged up to 41.2 hours in April. The factory workweek has been above 41 hours now for three straight months. This hasn’t happened in two years. A longer factory workweek combined with the higher PMI is consistent with a manufacturing sector that is rebounding from a lackluster 2016. Average weekly Manufacturing Earnings tailed off for the first time in four months in April to $843.19. Inflation adjusted earnings, however, were higher than a year ago for the fourth consecutive month. That is a turnaround from 2015 and 2016 when inflation-adjusted earnings were lower when compared to the previous year.
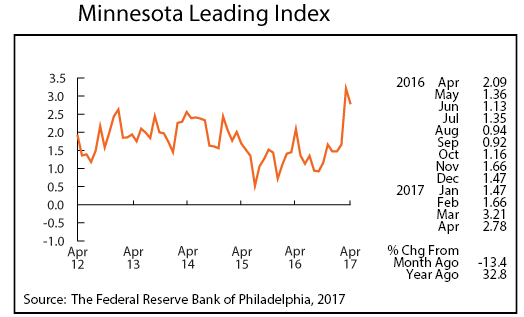
After reaching a seven-year high in March, the Minnesota Leading Index slipped slightly in April to 2.8. The robust reading indicates strong economic growth for Minnesota over the next six months. The leading index has averaged 1.5 since 1982 so the 2.8 reading suggest near term growth well above average.
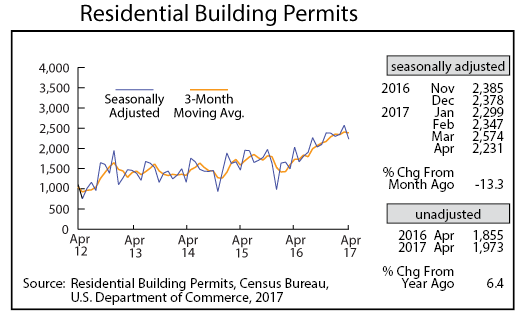
As expected, adjusted Residential Building Permits declined significantly in April. Building permit levels were unusually high during the first few months of the year, most likely because of the mild winter. April’s drop was probably just payback for the high numbers earlier in the year. Home-building permit numbers, however, have gotten off to the best start since 2006. Solid construction employment hiring will likely continue based on the elevated building permit level.
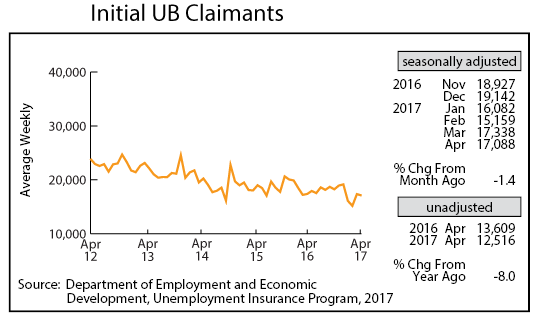
Adjusted Initial Claims for Unemployment Benefits (UB) inched down to 17,088 in April. Initial claims continue to run near record low levels when the size of the workforce is accounted for. Since 1970 Minnesota has averaged 10 initial claims per month for every 1,000 workers employed. That ratio was half the average this April with five initial claims for every 1,000 workers employed. Job growth will continue to be solid through at least the summer based on the low rate of initial claims.
