May 2020

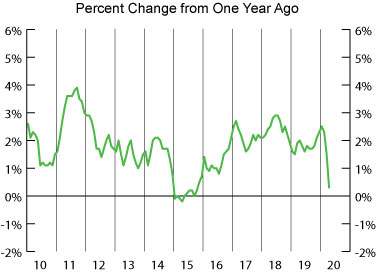
The Consumer Price Index for All Urban Consumers (CPI-U) declined 0.8 percent in April on a seasonally adjusted basis, the largest monthly decline since December 2008 the U.S. Bureau of Labor Statistics reported today. A 20.6 percent decline in the gasoline index was the largest contributor to the monthly decrease, but the indices for apparel, motor vehicle insurance, airline fares, and lodging away from home all fell sharply as well. The index for all items less food and energy fell 0.4 percent in April, the largest monthly decline in the history of the series, which dates to 1957.
The all items index increased 0.3 percent for the 12 months ending April, the smallest 12-month increase since October 2015. The index for all items less food and energy increased 1.4 percent over the last 12 months, its smallest increase since April 2011. The energy index fell 17.7 percent over the last year. In contrast, the food index rose 3.5 percent over the last 12 months, its largest 12-month increase since February 2012.