by Dave Senf
November 2015
Note: All data except for Minnesota's PMI have been seasonally adjusted. See the feature article in the Minnesota Employment Review, May 2010, for more information on the Minnesota Index.
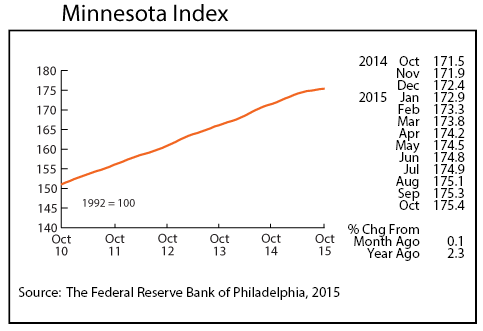
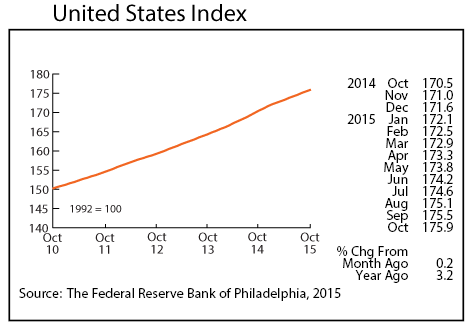
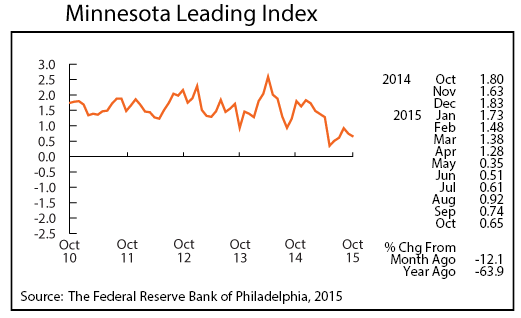
The Minnesota Index climbed 0.1 percent for the fourth straight month in October. The strength of the index over the last few months was revised downwards with October's release. Declining wage and salary jobs along with waning average weekly manufacturing hours have dragged the index down despite the unemployment rate's sliding to 3.7 percent in October from 4.0 percent in August. The U.S. index advanced 0.2 percent for the third straight month. The revised index now shows that Minnesota's index has been lagging the U.S. index over the last six months. Minnesota's index is up 2.3 percent over the last 12 months compared to a 3.2 gain recorded by the U.S. index over the same time span.
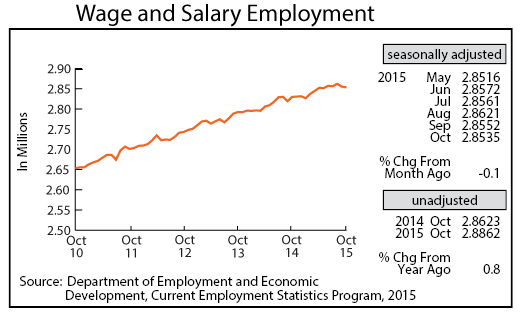
Adjusted Wage and Salary Employment declined for the second month in a row, dropping by 1,700 jobs in October. All of the decline was in the private sector where 2,200 jobs were cut while public sector payrolls increased by 500. Leisure and Hospitably along with Construction accounted for most private sector job loss. Strong job growth in Professional and Business Services and Other Services offset some of the job cutbacks in other sectors.
Minnesota's private sector employment has decreased for two consecutive months for the first time since February 2010. Trade, Transportation, and Utilities and Construction payrolls have slipped for four consecutive months. The last time these two sectors experienced four consecutive months of declining payrolls was back in 2009. The job numbers will all be benchmarked in March so the multi months of jobs lost in various sectors may be revised away.
Minnesota's unadjusted over-the-year job growth plunged to 0.8 percent in October, the lowest annual gain since December 2014. The U.S. rate stayed at 1.9 percent for the second month in a row. Minnesota's over-the-year job growth rate has lagged the U.S. rate for 15 straight months and 27 of the last 28 months. Minnesota's unemployment rate continues to run significantly lower than the U.S. rate although suggesting that Minnesota's slower job growth may be mostly caused by businesses having a hard time finding employees.
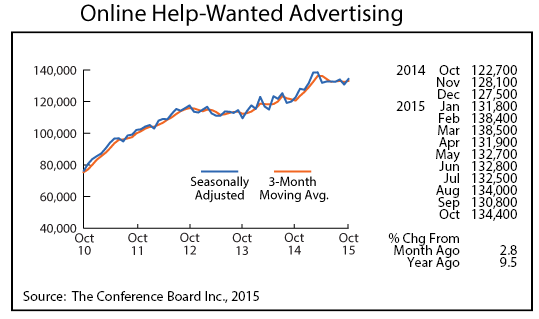
Minnesota's adjusted Online Help-Wanted Ads ticked up 2.8 percent in October to 134,400 ads, the third highest monthly level in the 10-year series, while U.S. online advertising climbed by 3.3 percent. Minnesota's online help-wanted ads continue to account for 2.5 percent of national ads even though the state's share of national wage and salary employment is 2.0 percent.
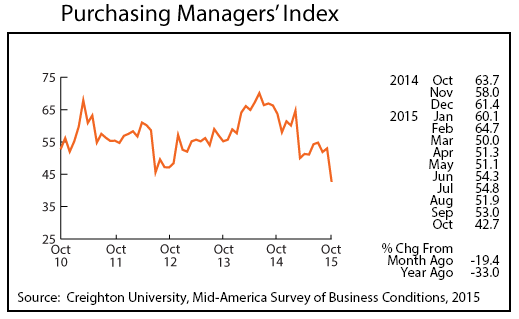
Minnesota's Purchasing Managers' Index (PMI) plunged to its lowest level since May 2009, falling to 42.7. The low reading suggests that Minnesota manufacturers have hit a rough patch that will slow expansion in that sector through at least the first few months of 2016. Minnesota's PMI index, which had been outperforming both the U.S. and Mid-American indices, fell way below the U.S. index (50.1) and was only slightly better than the Mid-American index (41.9).
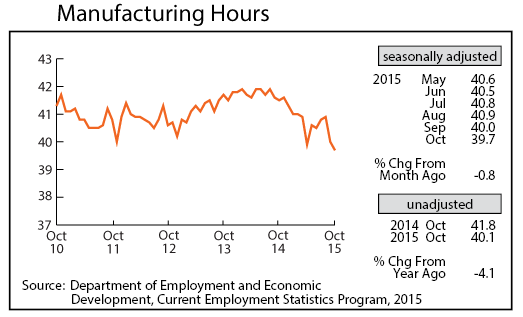
Adjusted Manufacturing Hours continued to drop sharply for the second month in a row in October, falling to 39.7 hours, the lowest factory workweek since November 2009. The short factory workweek is consistent with the low PMI. Manufacturing hours have dipped below 40 hours per week roughly 28 percent of the time since 1950 with most of those shorter workweeks occurring during recessions.
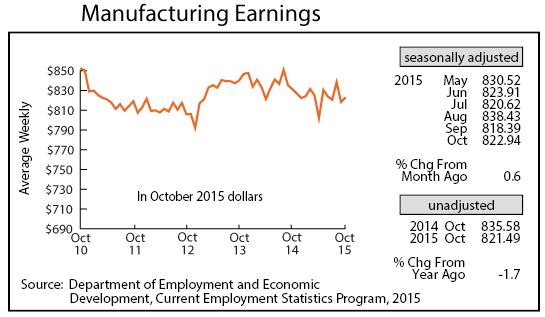
Manufacturing Earnings rose slightly in October to $822.94 but continue to be down significantly from last year even after adjusting for inflation.
Revisions in the Minnesota Leading Index show a downward trend in Minnesota's near-term economic growth. The index dropped for the second month in a row and has averaged only 0.6 since May after averaging 1.5 during the first four months of 2015. The string of low readings implies that Minnesota's economic growth will be way below the U.S. rate over the next six months.
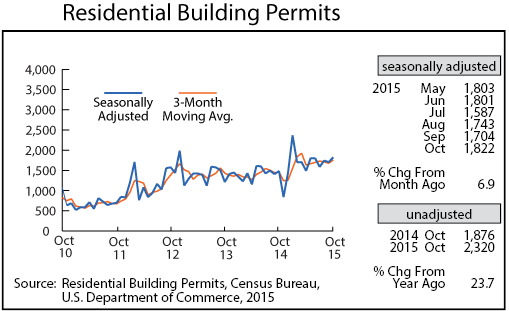
Adjusted Residential Building Permits jumped to their second highest monthly total this year in October, climbing to 1,822. Minnesota's home-building activity, while still below normal, was one of the few positive indicators in October.
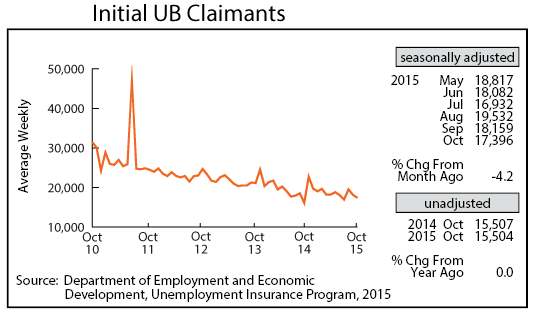
The number of Minnesotans filing for first-time unemployment benefits inched down in October as adjusted Initial Claims for Unemployment Benefits (UB) dropped to 17,396, the second lowest monthly total of the year. The low level of layoffs usually suggests job growth will be strong but labor shortages are probably holding job growth down.
*Over-the-year data are not seasonally adjusted because of small changes in seasonal adjustment factors from year to year. Also, there is no seasonality in over-the-year changes.