
by Oriane Casale and Nicholas Dobbins
June 2022
A lack of available workers slowed Minnesota's employment growth into 2022, revisiting a trend that we were seeing prior to the pandemic. This tight labor market persists in Minnesota despite the state having one of the highest labor force participation rates in the nation. Unemployment hit an all-time Minnesota low of 2.2% in April 2022, with the number of unemployed Minnesotans also at an all-time low of 67,631. Finding available workers to fill positions is a critical need for Minnesota employers. This article provides an overview of employment growth and labor force trends as Minnesota continues to recover from the economic impacts of the pandemic.
Following a tumultuous 2020, nonfarm employment growth in Minnesota stabilized in 2021 and early 2022. The onset of the pandemic in early 2020 brought the largest over-the-year (OTY) employment decline in Minnesota since we started tracking the data in 1950, with April 2020 employment down 13.4% from the previous year.
The twenty-four months that followed that sharp decline have been a consistent attempt to claw back those losses. As we proceed into 2022, that growth continues. In April 2022, unadjusted total nonfarm employment in Minnesota sat at 2,882,480 jobs. This marked an improvement of 12.4% over April of 2020. It represented 97.8% of the pre-pandemic employment peak of 2,948,630, set in February 2020.

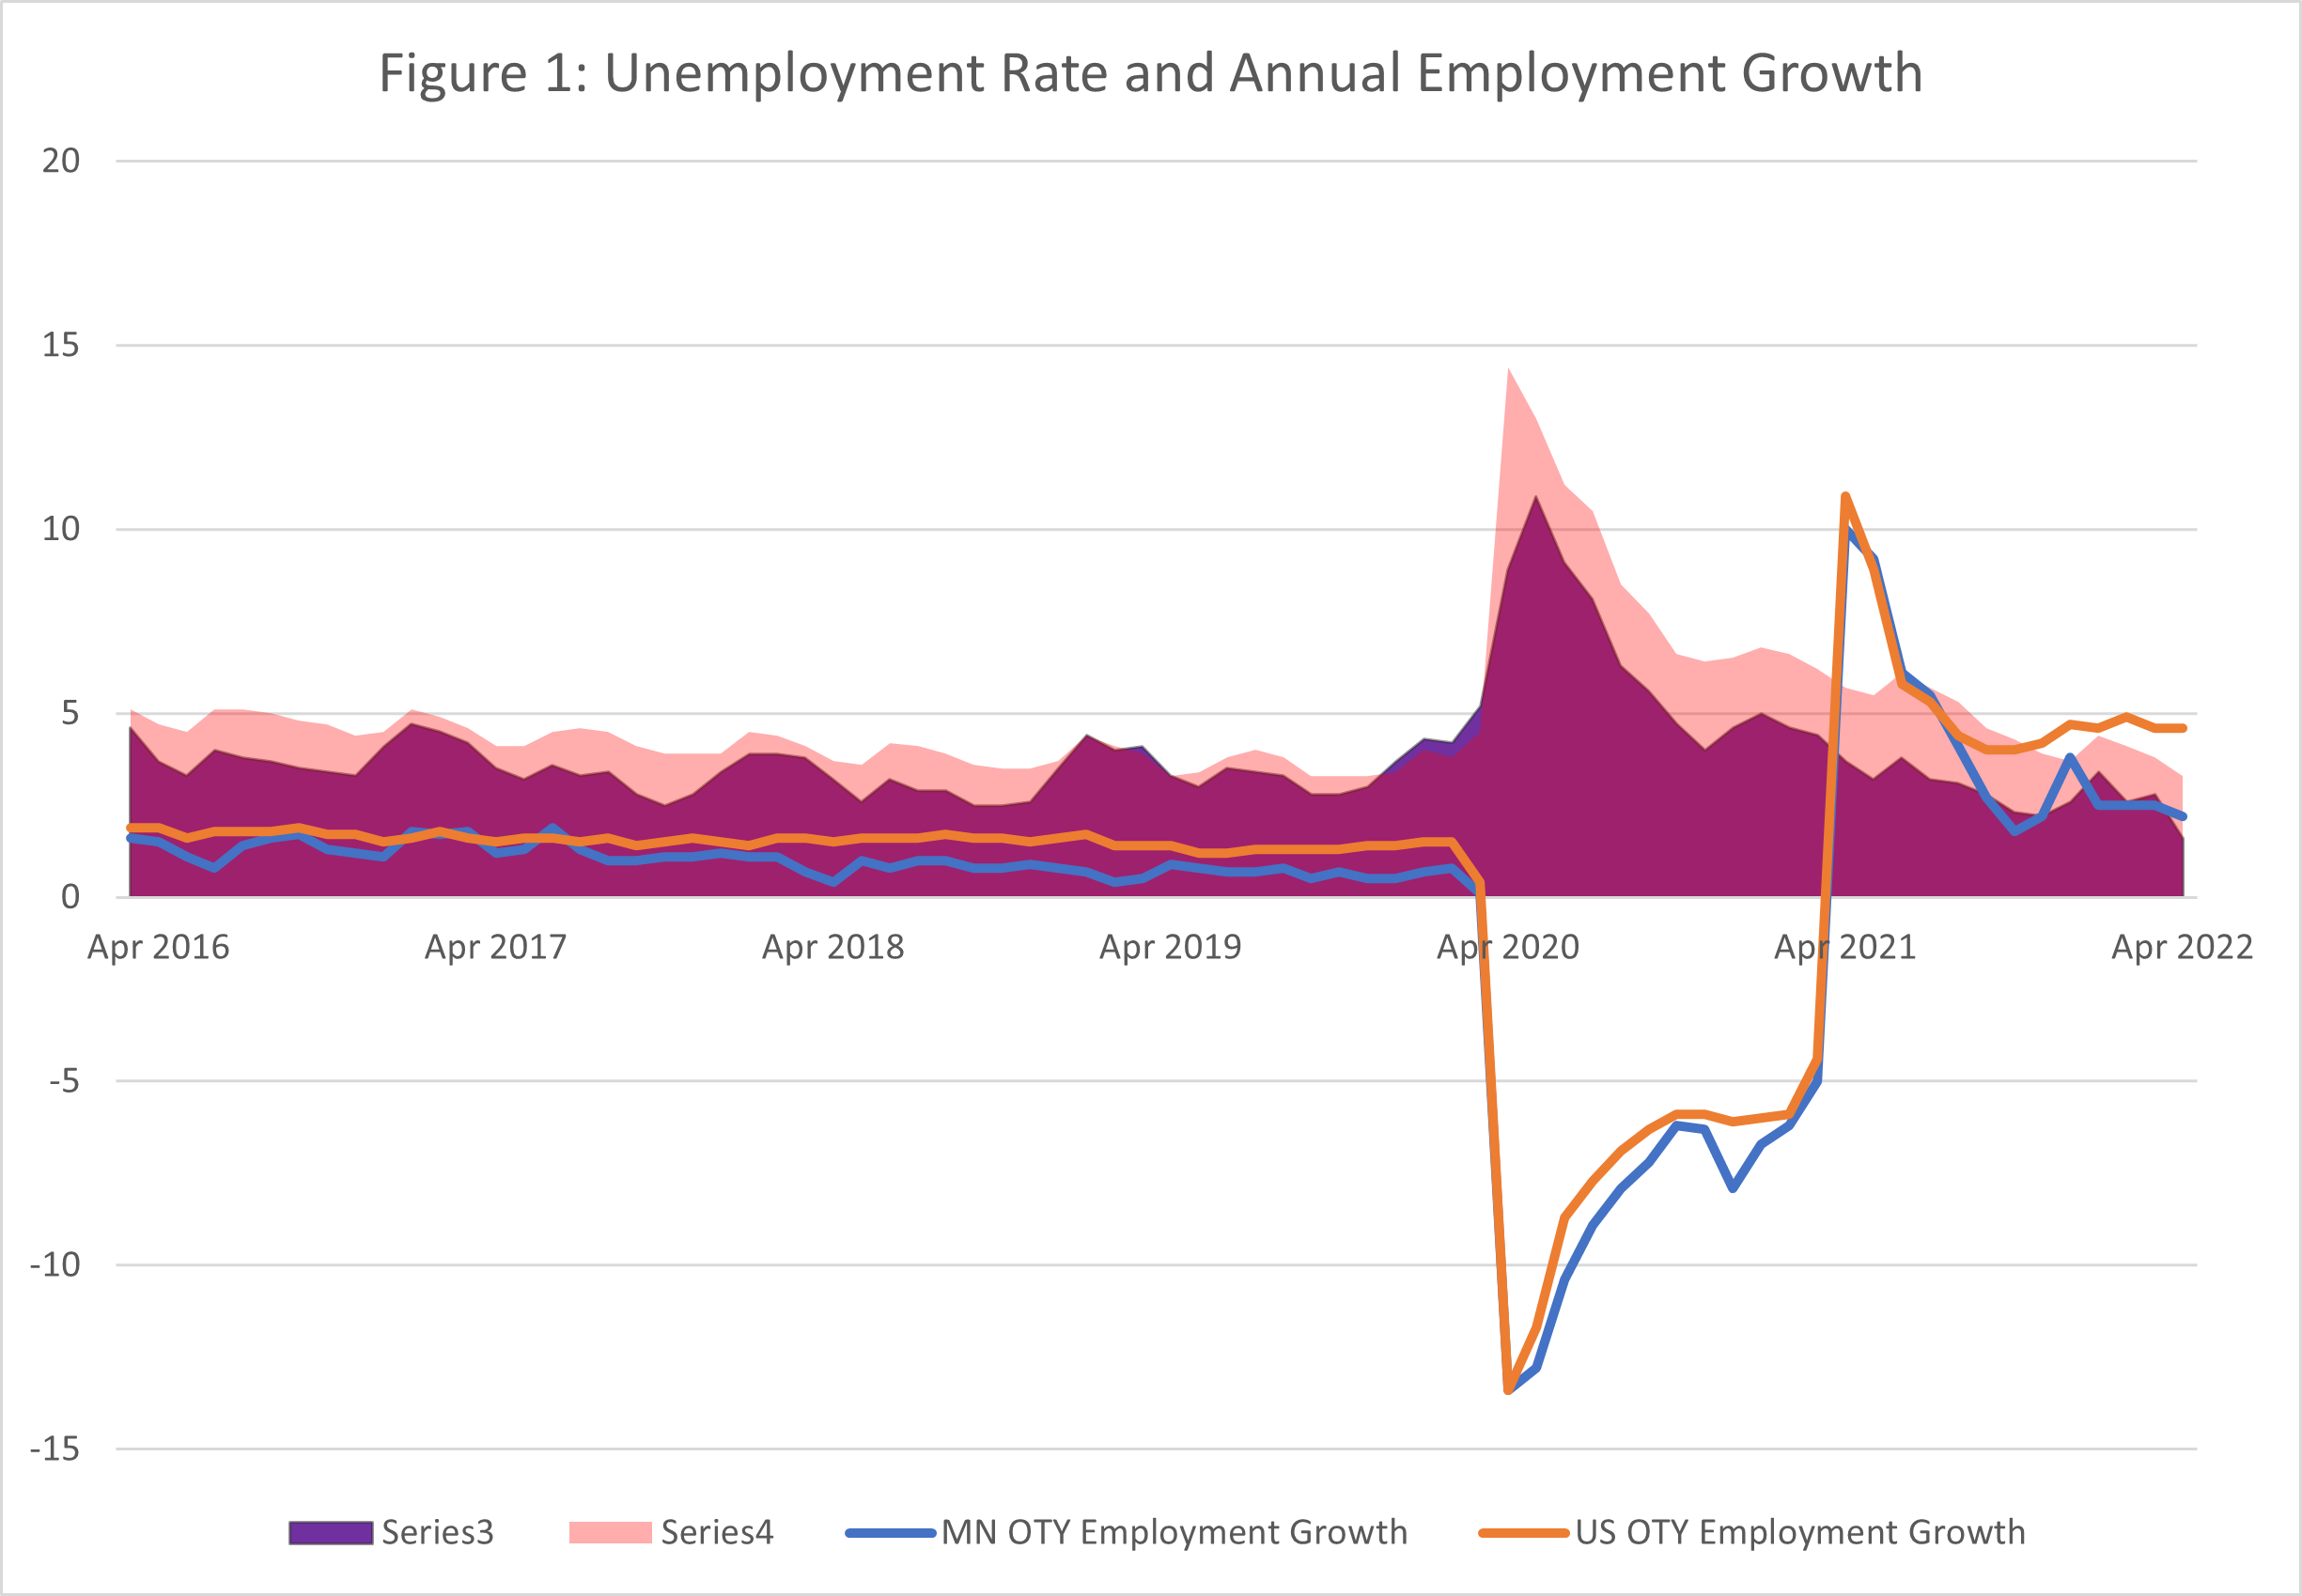
As Figure 1 illustrates, over-the-year growth in Minnesota and the United States has remained higher than pre-pandemic levels during 2022, which is consistent with an ongoing recovery. However, growth in Minnesota has hit a plateau in recent months, dipping well below national employment growth levels in September 2021 and continuing to lag national growth since then. This discrepancy was primarily driven by labor market constraints rather than lack of available jobs. Minnesota's labor force participation rate (LFPR) has remained lower than our pre-pandemic rate (68.1% as of April 2022, after having not dipped below 70% for any month in 2019) but still significantly higher than the national LFPR of 62.2% in April 2022. Our unemployment rate is even lower, coming in at 2.2% in April preliminary estimates, an all-time low in Minnesota. At the same time, numerous industries have reported difficulties in hiring.
On a seasonally adjusted basis, Minnesota lost 416,300 jobs from February through April 2020. Since then, we have gained 329,500 jobs, or 79% of the jobs lost. In total Minnesota is back above 97% of the employment level prior to the pandemic in February 2020. Job losses did not hit every industry equally, and the ongoing recovery has likewise been unbalanced. Industries where in-person interaction and close contact with customers is necessary have been harder hit than industries where remote or distance work is easier.
As Table 1 shows, initial losses were most severe in Leisure & Hospitality and Other Services, with smaller losses in industries like Financial Activities and Mining & Logging.
| Industry | February 2020 | April 2020 | April 2022 |
% Change Feb to April 2020 |
% Change Feb 2020 to April 2022 |
|---|---|---|---|---|---|
| Total Nonfarm | 2,995,500 | 2,577,900 | 2,907,400 | -13.9% | -2.9% |
| Total Private | 2,568,200 | 2,180,900 | 2,503,600 | -15.1% | -2.5% |
| Goods-Producing | 457,700 | 423,400 | 460,300 | -7.5% | 0.6% |
| Mining and Logging | 6,700 | 6,400 | 6,600 | -4.5% | -1.5% |
| Mining, Logging, and Construction | 134,800 | 121,300 | 134,200 | -10.0% | -0.4% |
| Construction | 128,100 | 114,900 | 127,600 | -10.3% | -0.4% |
| Manufacturing | 322,900 | 302,100 | 326,100 | -6.4% | 1.0% |
| Service-Providing | 2,537,800 | 2,154,500 | 2,447,100 | -15.1% | -3.6% |
| Private Service Providing | 2,110,500 | 1,757,500 | 2,043,300 | -16.7% | -3.2% |
| Trade, Transportation and Utilities | 529,400 | 465,800 | 517,700 | -12.0% | -2.2% |
| Information | 46,000 | 42,300 | 43,400 | -8.0% | -5.7% |
| Financial Activities | 195,700 | 191,400 | 193,700 | -2.2% | -1.0% |
| Professional and Business Services | 383,900 | 345,800 | 383,700 | -9.9% | -0.1% |
| Education and Health Services | 563,300 | 506,200 | 543,800 | -10.1% | -3.5% |
| Leisure and Hospitality | 277,000 | 127,800 | 253,600 | -53.9% | -8.4% |
| Other Services | 115,200 | 78,200 | 107,400 | -32.1% | -6.8% |
| Government | 427,300 | 397,000 | 403,800 | -7.1% | -5.5% |
While we remain behind pre-pandemic employment levels overall and recent growth has been steady, the industry breakout shows that the recovery, like the initial declines, has been inconsistent. The industries that were hit hardest by the pandemic, Leisure & Hospitality and Other Services, remain well behind their February 2020 levels (8.4% and 6.8%, respectively), while other industry groups have had stronger recoveries. Professional and Business Services was just 0.1% behind pre-pandemic levels in April, while Manufacturing has made up all its losses and grown by 1% over February 2020. Employment among goods producers overall was up 0.6% over February 2020, while service providers were still down by 3.6%.
Compared to April of 2019, four supersectors posted positive growth as of April 2022 (Professional & Business Services, Financial Activities, Construction, and Manufacturing) while another (Mining & Logging) is at 2019 levels.
While a full recovery to pre-pandemic employment levels is as yet incomplete, the past year has shown continued improvement across industries.
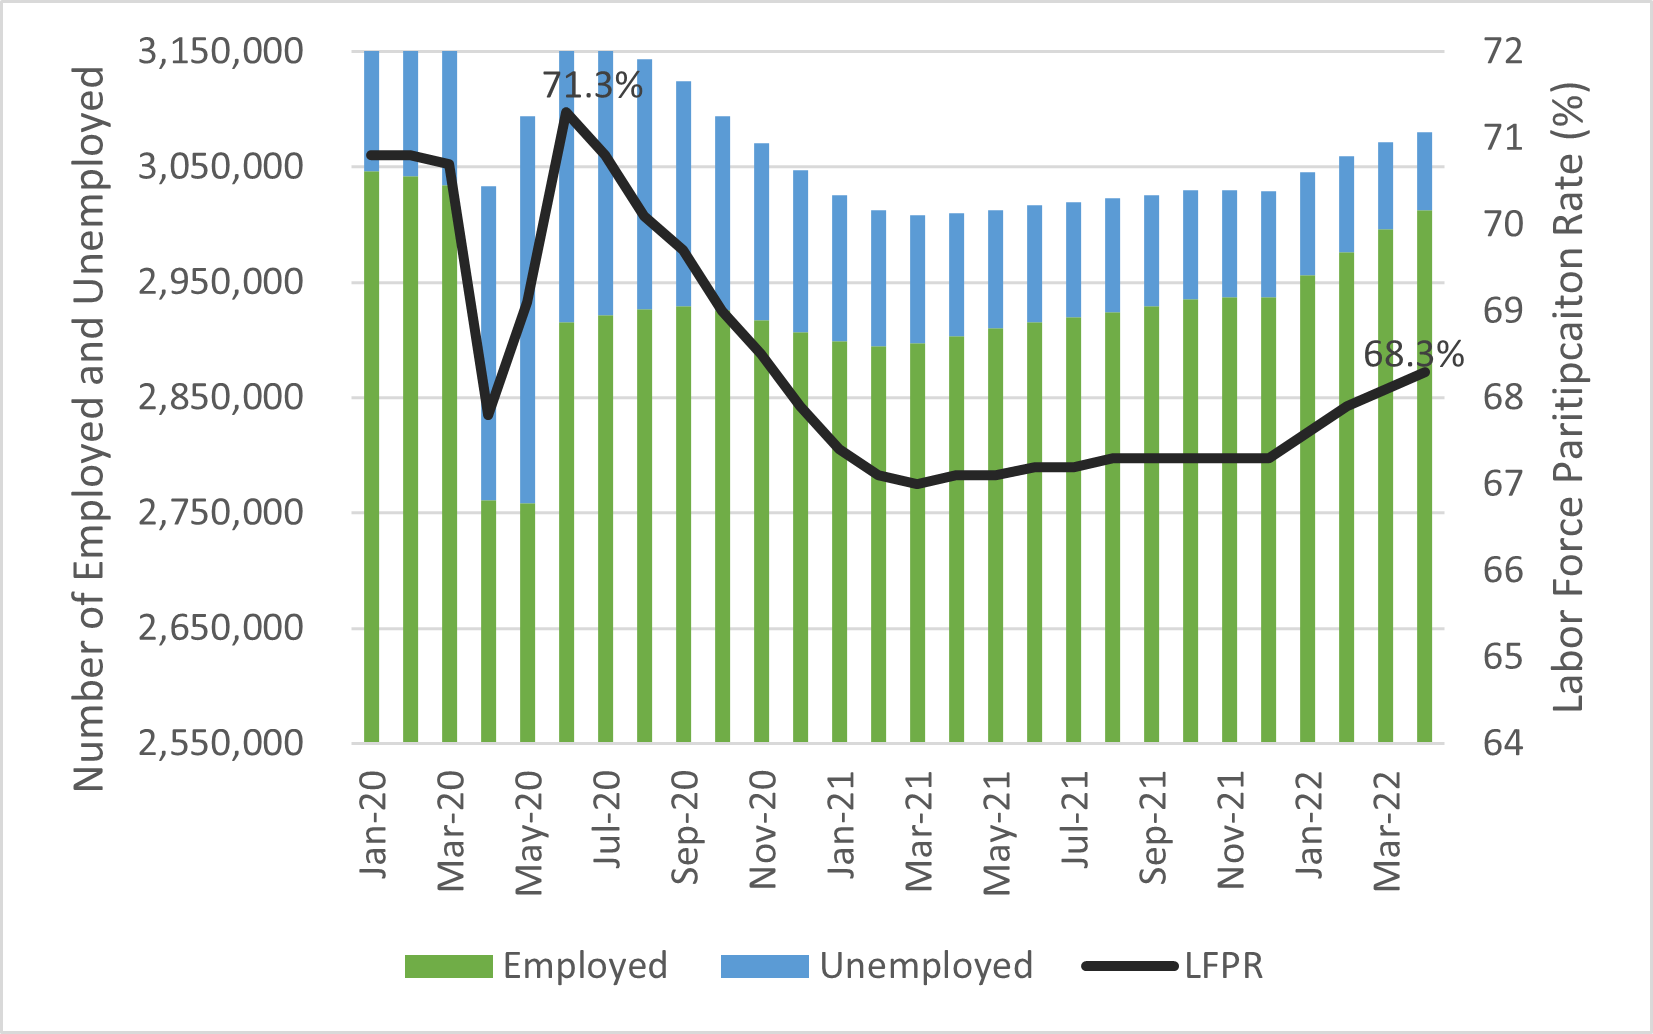
As Figure 2 illustrates, after peaking at 10.8% in May 2020, the unemployment rate declined steadily to an all-time Minnesota low of 2.2% in April 2022, with the number of unemployed also at an all-time low of 67,631 (record going back to 1976). There are 45% fewer unemployed workers in Minnesota in April 2022 than prior to the pandemic, or 55,000 short of the February 2020 level.
On the employment side, the number of employed workers dropped dramatically in April 2020, down almost 276,000 by May 2020, but jumped up by almost 157,000 in June as more than half of those laid off workers got back to work almost immediately. By April 2022, employment was back to 99.0% of its level in February 2020, just 29,000 workers short (see Figure 2).
These numbers indicate that as workers have moved back into the labor market, they have been successfully finding jobs. However, a significant number of workers remain out of the labor force and employers are struggling to find available workers to take jobs – and policymakers are searching for solutions including encouraging more people to return to the labor force and encouraging more foreign immigration and domestic migration to the state. Looking at employment and unemployment together, the overall size of the Minnesotan labor force remains 2.7% lower than prior to the pandemic, or 84,700 works short of February 2020. In comparison, the national labor force remains 0.3% lower than prior to the pandemic, or 500,000 workers.
The LFPR is the aggregate of employed plus unemployed over the civilian population age 16+. With both employed and unemployed down from prior to the pandemic, the LFPR has yet to fully recover at just 68.3% in April 2022 compared to 70.8% in February 2020 in Minnesota (see Figure 2). The last time the LFPR was this low in Minnesota was in 1978. To put that in context, the national LFPR is currently at 62.2% down from 63.4% in February 2020.

Source: Local Area Unemployment Statistics
There are several reasons for the drop in the size of Minnesota's labor force. First and most impactful is an aging workforce. Labor force growth in the state has been on the decline since the early 2000s when the baby boom generation began to reach retirement age. Between 1990 and 2000 Minnesota added an average of 41,400 workers to its labor force annually, but between 2000 and 2010 that dropped to an annual average of 12,800 and between 2010 and 2020, the annual average increase was 18,100. In 2020 Minnesota's labor force shrank by 8,300 and then by another 101,600 in 2021, likely due in part to more older workers deciding to leave the labor force. So not only has growth slowed over the last three decades but the pandemic recession took a huge toll.
We have yet to see what 2022 holds in terms of labor force growth, but one good sign is that after 10 straight months of declines in the size of the labor force between May 2020 and March 2021, Minnesota has seen increases in 11 of the last 13 months since then, with the addition of 72,000 workers.
This steep drop during the pandemic and slow growth since has a number of explanations beyond planned retirements. If older Minnesota workers behaved like workers across the county, between 29,000 and 59,000 may have accelerated their retirement plans as a result of the COVID-19 pandemic. (Senf, David, Accelerated Retirements may be Playing a Role in the Current Workforce Shortage, Minnesota Economic Trends, September 2021). Some of these workers may be reentering the workforce as the pandemic ebbs and the stock market drops, but some will decide to stick with retirement.
Another reason for the steep drop and subsequent slow growth in the labor force is that parents and others responsible for caregiving within their families were forced to drop out of the labor force when schools, early learning programs, day programs and other types of child care programs shut down during the pandemic. Schools and other programs continued to face shutdowns and children and adults continued to face unpredictable periods of quarantine throughout 2021 and into 2022 slowing many parents and care givers return to the labor force.
A final reason is the changes in immigration policies and trends during the pandemic period. Looking just at the size of the civilian labor force age 16+, the number of Hispanic Minnesotans fell by 33,900 or 15% between February 2020 and April 2022, compared to a drop of 54,000 or 1.5% for white Minnesotans and 2,000 or 1% for Black Minnesotans. This indicates that much more than age demographics were at play for Hispanic Minnesotans, including a change in immigration and work visa rules as well as an increase in opportunities elsewhere within the U.S.
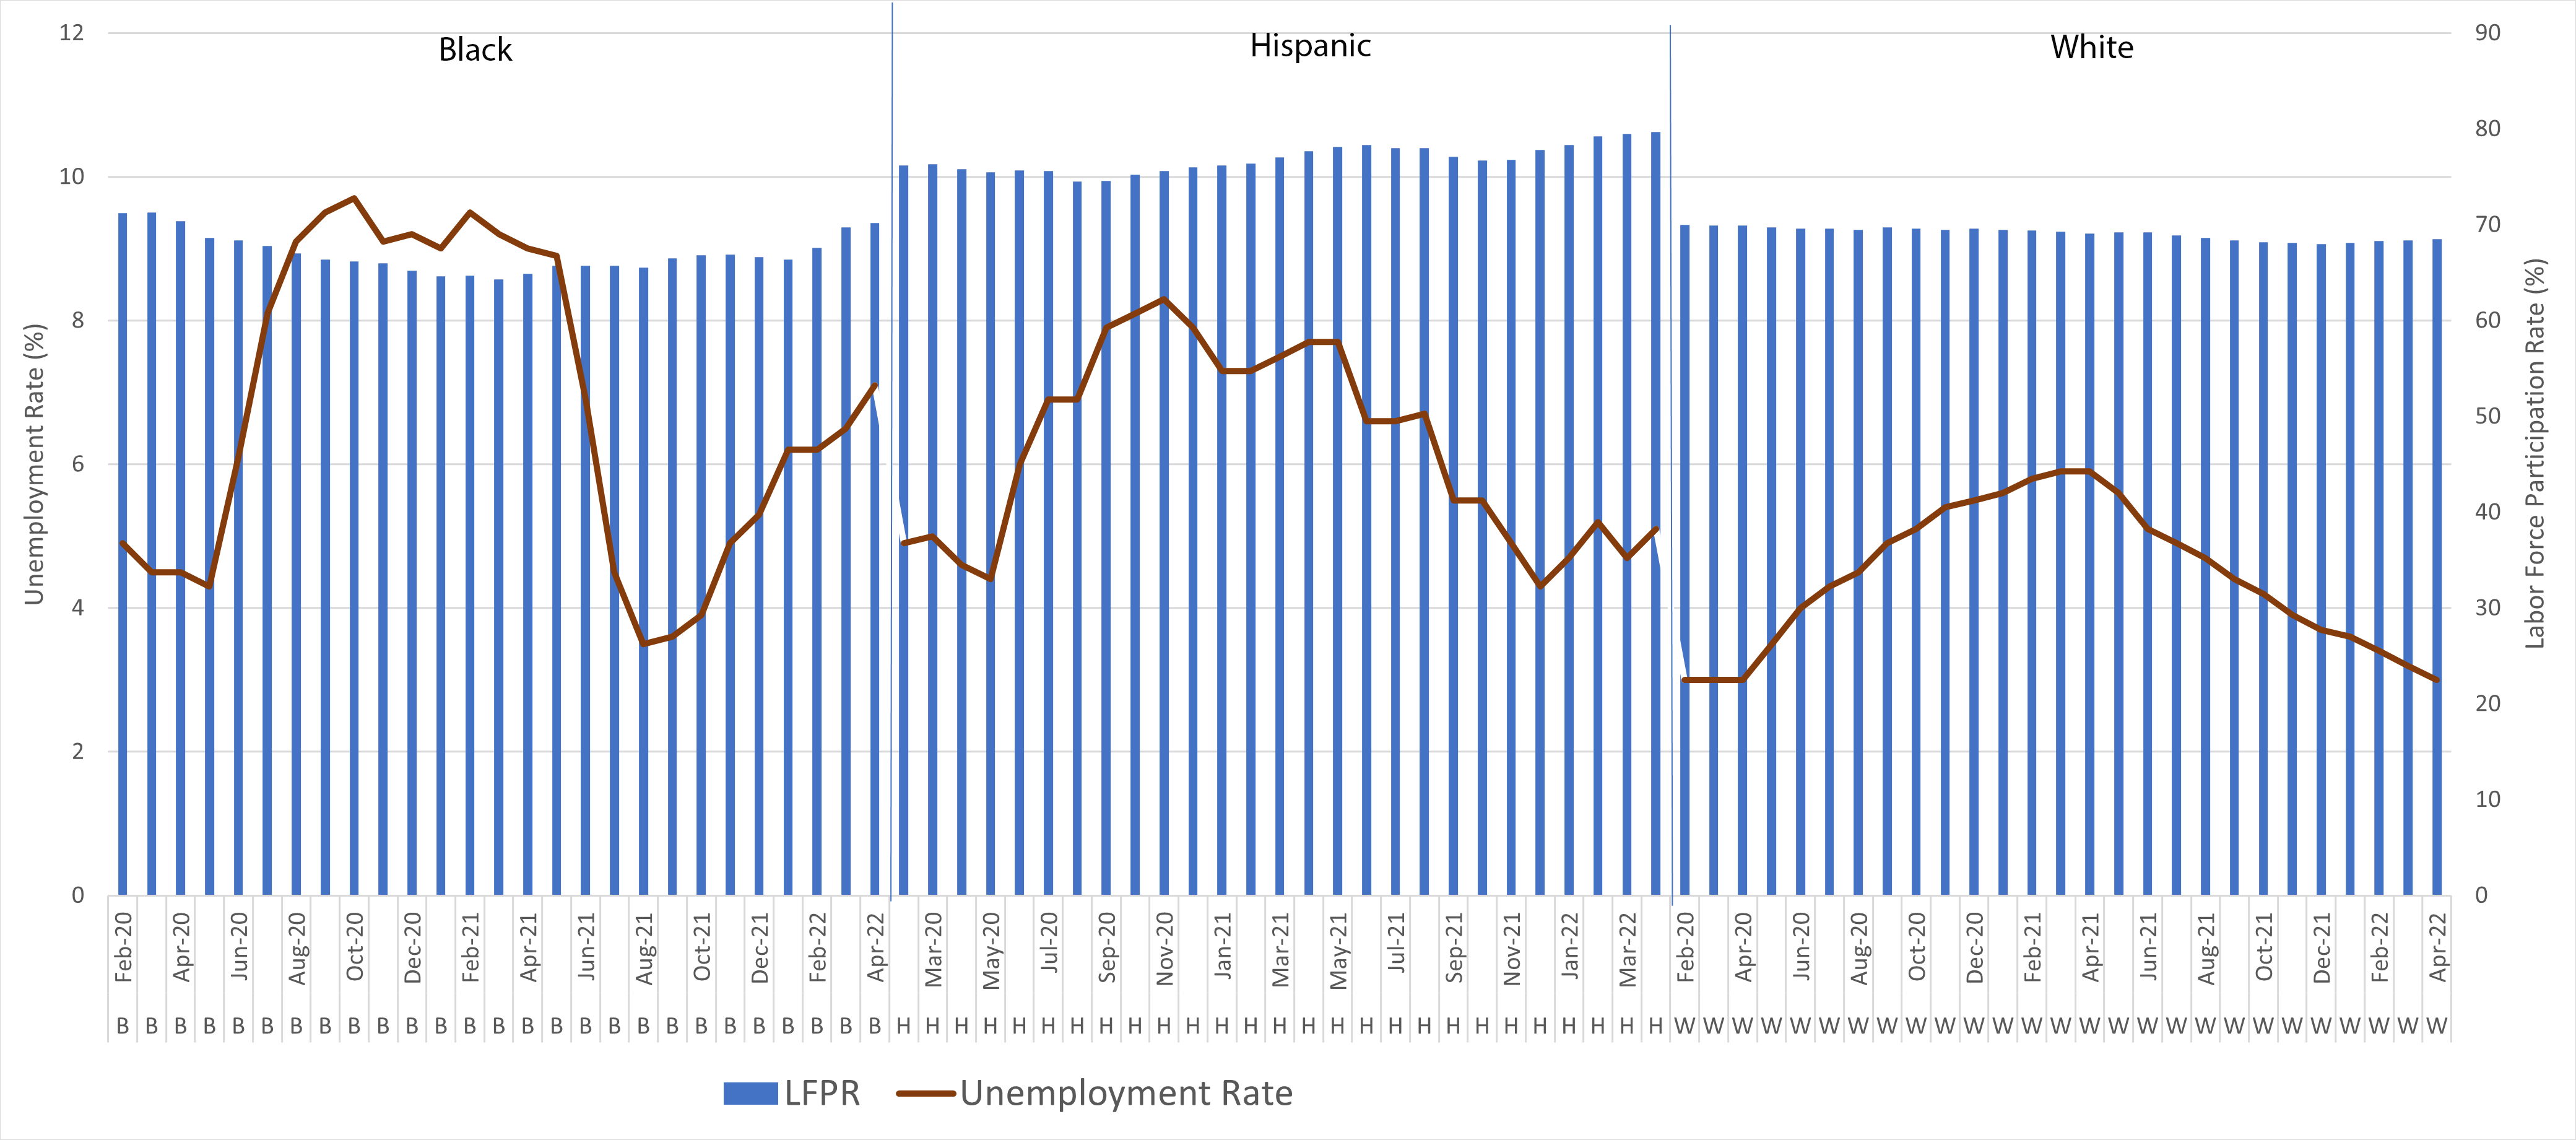
As Figure 3 illustrates, compared to the other two groups, Black Minnesotans experienced the sharpest rise in unemployment rates and the steepest dip in LFPRs compared to Hispanic and white workers during the pandemic. Coming out of the pandemic recession, Hispanic Minnesotans were the only group to see an increase in LFPR, up 3.9 percentage points from February 2020. This group also saw the greatest decline in their unemployment rate, down 0.5 percentage points. (Black, Hispanic and white workers are the only three racial groups we're able to track on a monthly basis because of the small sample size of the Current Population Survey, the survey that generates these stats.)
White Minnesotans have also continued to see a drop in population, down 57,400 from February 2020 or 1.5%. But unlike Hispanic Minnesotans, white Minnesotans have continued to see a decline in their LFPRs, down 1.4 percentage points from February 2020. The combination of declining population and declining LFPR has resulted in 92,200 fewer white Minnesota in the labor force between February 2020 and April 2022.
Both Black and Hispanic Minnesotans now have higher LFPRs than white Minnesotans, at 70.7% for Black workers and 80.2% for Hispanic workers compared to 68.5% for white workers. In contrast, Black and Hispanic Minnesotans continue to have higher unemployment rates than white Minnesotans at 6.7% for Black workers, 4.5% for Hispanic workers compared to 2.8% for white workers (see Figure 3).

Source: Demecon, Current Population Survey, 12-month moving averages
Job growth continued its strong pattern in Minnesota with the number of jobs in April 2022 back up to 97.1% of its February 2020 level. Labor force growth has also been steady with growth in 11 of the last 13 months. The good news is that as workers reenter the labor force, they are quickly finding jobs. In April 2022, employment was at 99.3% of where it had been in prior to the pandemic. The strong job market is pushing unemployment to historic lows, with both the number of unemployed and the unemployment rate at record lows in April 2022.