by Dave Senf
September 2013
Note: All data except for Minnesota's PMI have been seasonally adjusted. See the feature article in the Minnesota Employment Review, May 2010, for more information on the Minnesota Index.
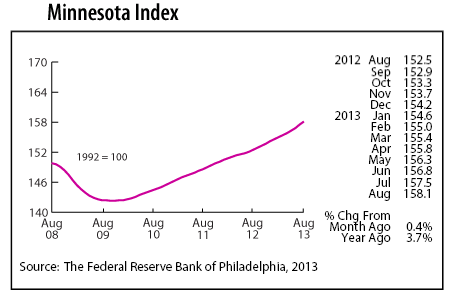
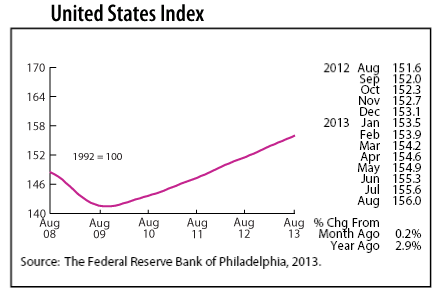
The Minnesota Index advanced for the 45th straight month in August climbing 0.4 percent. The only negative component of the index last month was slipping average weekly manufacturing hours. Wage and salary employment surged in August, and the state's jobless rate dipped another 0.1 percentage point. The U.S. index increased 0.2 percent last month. Minnesota's index has been racing ahead of the national index for the last four months suggesting that Minnesota's economy has been expanding at a faster rate than the U.S. economy since May.
Minnesota's index in August was 3.7 percent higher than a year ago while the U.S. index was 2.9 percent higher than last year. The 3.7 over-the-year reading suggested that Minnesota's GDP expanded by 3.7 percent last month. This is the fastest monthly economic growth since July 2000.
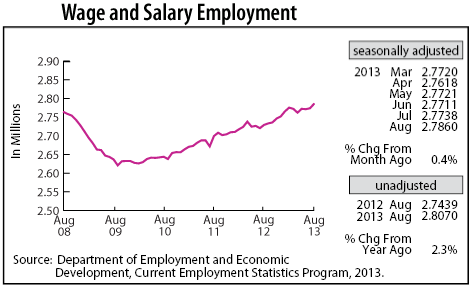
Minnesota's Wage and Salary Employment added a robust 12,200 jobs in August, the largest monthly gain since January. Private jobs were up 12,600, the largest monthly jump in private employment since April 2005. The job report wasn't all roses though as manufacturing employment declined by 3,400 jobs, the steepest decline since May 2009. Payroll numbers also slipped in Professional and Business Services and in Information. Hiring was strongest in Retail, Transportation, and Utilities, in Educational and Health Services, and in Other Services.
Over-the-year job growth using unadjusted employment numbers slipped a bit in Minnesota to 2.3 percent in August. The national growth was 1.7 percent over the same period. Minnesota's job growth for the year is currently headed for 1.9 percent while the U.S. rate, if the current trend holds, is headed for a 1.7 percent annual average job growth for 2013. A 1.9 percent annual average job growth for the state would be the fastest pace since 2000.
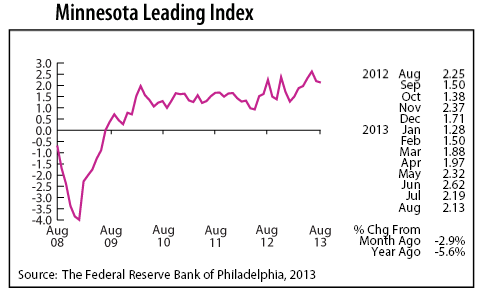
The Minnesota Leading Index continues to run red hot, coming in at 2.13 in August. The index has been above 2.0 for four months in a row. That hasn't happened since 1997 during the boom years. The 2.13 reading suggests that Minnesota's economy will expand by more than 2 percent over the next six months.
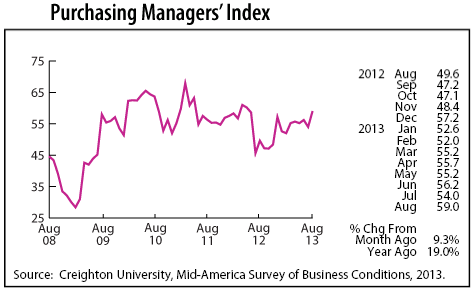
Minnesota's Purchasing Managers' Index (PMI) spiked to 59.0 in August, advancing to a 15-month high. August's strong reading implies that Minnesota's economy has accelerated over the last few months and should continue at a robust pace through the rest of the year. The strong PMI reading, however, is inconsistent with recent job cutbacks in manufacturing. The employment component of the PMI has been above 50 for 10 consecutive months suggesting that manufacturing hiring should be rising, not tailing off.
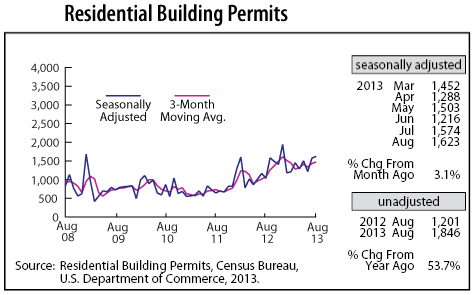
Adjusted Residential Building Permits climbed for the second month in a row, reaching a 2013 high of 1,623. Minnesota's housing market continues to bounce back, but the rebound road continues to be bumpy. Home building permits have averaged 50 percent more over the last six months compared to a year ago. Other housing statistics also continue to show improvement from a year ago. All of these signs point toward homebuilding activity continuing to gain steam over the next six months.
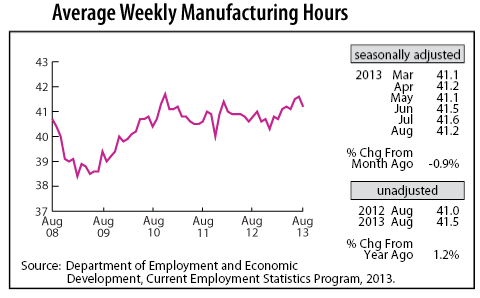
Adjusted Manufacturing Hours stumbled in August, falling off to 41.2 hours. Factory hours remain strong, however, exceeding 41 hours for six straight months. That is the best showing in over two years.
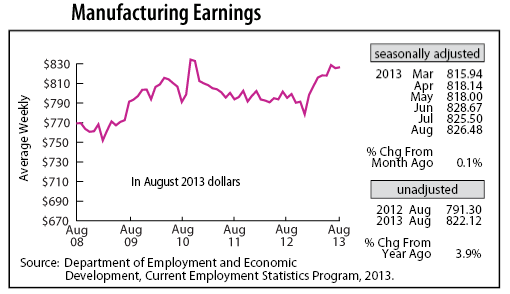
Manufacturing Earnings rose slightly to $826.48 last month. Factory paychecks have been running around 3 percent higher than last year, after adjusting for inflation, for the last six months. This is the biggest real gain in factory paychecks since the last half of 2010.
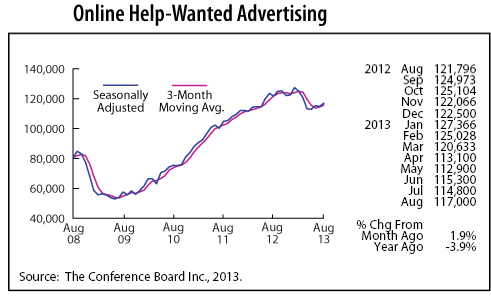
Minnesota's adjusted online Help-Wanted Ads rose 1.9 percent in August to the highest volume since March. Minnesota's online help-wanted ad level, however, has been lower compared to a year ago for five months in a row. Fewer help-wanted ads suggest that labor demand has dipped compared to last year, but job growth has been significantly stronger over the summer this year than last year. The help-wanted online decline is inconsistent with the recently released Job Vacancy Survey, which reported job vacancies up 17 percent in the second quarter of 2013 compared to 2012.
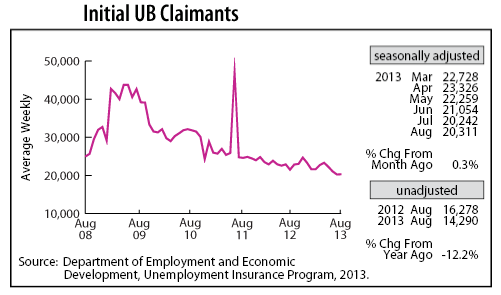
After declining in the previous three months, Adjusted Initial Claims for Unemployment Benefits (UB) inched up in August, rising 0.3 percent. The number of Minnesotans filing new claims for unemployment, however, continues to run close to a 13-year low. Initial claims are on track to average around 21,600 for the year, the lowest level since 2000. Low levels of initial claims usually indicate low layoff rates which traditionally correlate with robust hiring.