by Luke Greiner
June 2021
Outside of the Twin Cities, Central Minnesota has more jobs and more job openings than any other region, but recently its share of openings (job vacancies) outpaced its share of employment, with 11.1% of the state's openings compared to 9.7% of the state's employment in 2020. Of course, workers need to fill an opening before it can be counted in the employment data, and so begins a new age of hiring difficulties.
The tight labor market of the longest expansionary period in modern times is back, but it's different following the pandemic recession. Central Minnesota had more than 14,000 job openings in the 4th quarter of 2020, roughly the same as 2018 and 2019, showing a return to pre-pandemic hiring demand. But unlike those years, the regional labor force declined substantially instead of growing.
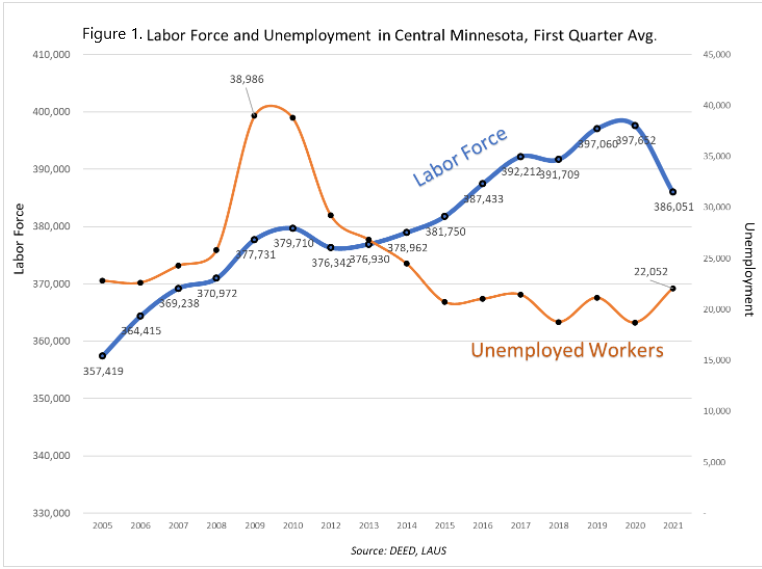
The number of workers receiving Unemployment Insurance (UI) as of April 2021 is roughly double compared to the years prior to 2020, but the number of workers unemployed (not working but available and actively seeking work) has remained relatively constant. In fact Central Minnesota actually had about 500 fewer unemployed workers this March than it did in March of 2019. For perspective, the number of unemployed workers in March of 2021 is about half the amount the region had just after the Great Recession in March 2010 (see Figure 1). While employers might expect to find lots of workers coming out of a recession, that isn't the case this time around.

Part of this dynamic is the decline in the labor force. From March 2019 to March 2021, Central Minnesota had about 12,000 fewer workers, a decline of -3%. Fortunately, that was the second lowest decline in the state, which saw labor force declines in every region, but labor force trends are heading in the wrong direction for employers that are looking to hire right now.
Similar to national headlines about labor force declines during the pandemic, Central Minnesota also had fewer workers coming into 2021 than it had in the first part of 2020. However, labor force growth has been slowing for decades. First quarter labor force growth averaged just 0.8% annually from 2005 to 2020. That small amount of growth is critical for businesses to expand and the regional economy to grow. The decline from the first quarter of 2020 to the first quarter of 2021 amounted to -2.9%, a loss of around 12,000 workers, effectively erasing labor force gains from the past four years (see Figure 2).

It's still too early to tell who is leaving the labor force in Central Minnesota, but national indicators point to women and older workers as the most likely exits. With a strong stock market, increased health risks at work, and many retirement eligible workers, it's possible the current conditions accelerated labor force exits of retirees. Almost 5% of Central Minnesota's labor force is 65 years or older, representing more than 18,000 workers, so any loss would be noticeable.
On the other hand, Child Day Care Services employment dropped by almost 200 jobs, a 12.4% loss, and many schools were in distance learning status on and off over the past year. This could contribute to fewer women (who are most often the primary caretaker of children) being able to work outside the home because they need to care for their children instead.
The labor force has certainly shifted dramatically, but the number of unemployed workers (not working but actively seeking work) remained at levels similar to the past five years. One likely factor for the missing spike in unemployed workers is that the vast majority of workers were laid off temporarily in the past year, so they might not be looking for a different job if they plan to return to their previous employer, and thus not be counted as "unemployed".
Coupled with the shrinking labor force are record numbers of job openings. The fourth quarter of 2020 saw 14,133 openings in Central Minnesota, just 106 fewer openings than the highest 4th quarter number of openings ever reported. Sales & Related Occupations posted the largest amount of openings, followed by Food Preparation & Serving Related Occupations, which was the same occupational category that had the largest amount of layoffs last year. The mass layoffs of 2020 happened basically overnight, but rehiring workers is proving to be a more lengthy process.
The challenge is that there is no surplus of untapped labor like there was in the aftermath of the Great Recession for employers to draw from, and the region has fewer workers that are employed, which leads to fewer workers unemployed through frictional unemployment, or who become temporarily unemployed while they are changing jobs. This labor market dynamic will likely lead to rising wages and hiring struggles until the labor market adapts.
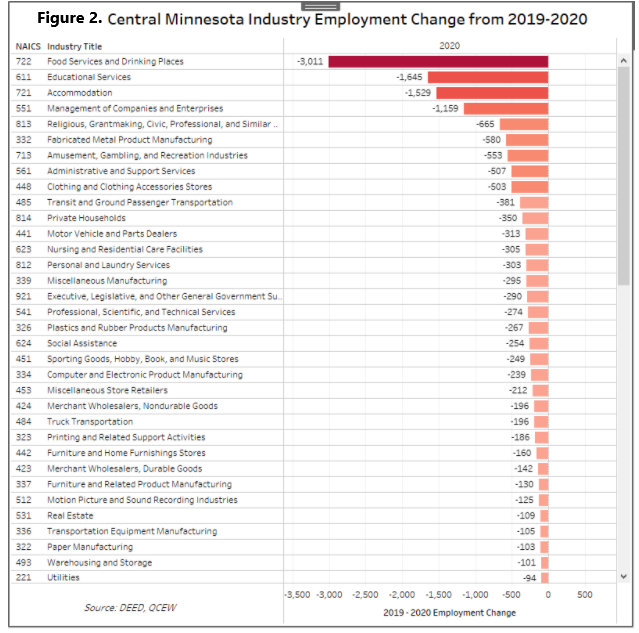
Central Minnesota employers shed 15,260 jobs in 2020, a drop of -5.5%, more than the 13,720 jobs lost during the Great Recession (2007-2009). While the vast majority of industries lost jobs in 2020, a few had stable employment or gained jobs. The largest contributor of job loss is the crippled Accommodation & Food Services industry that ended 2020 with 4,541 fewer jobs (-19%) than it had in 2019. The job losses were so concentrated in this subsector that they were nearly double the next hardest hit industry. The Manufacturing industry shed 2,483 jobs in Central Minnesota, a loss of -5.9%.
In contrast, Construction, Finance & Insurance, Agriculture, and Mining were the only industry supersectors to end 2020 with net employment gain. Altogether they added 736 net new jobs, which is small comfort in comparison to the large job losses in the other supersectors.
It's important to note these employment data have no minimum hour requirement to be counted as a job. So long as there is an hour worked and the job is covered by UI it is counted, meaning a job that requires 40 hours per week is indicated no differently than a job requiring just 10 hours per week, so the chart in Figure 3 does not account for a reduction in hours.
Parsing through a more detailed breakdown of industries, it becomes more clear that losses were highly concentrated in just a few sub-sectors including: Food Services & Drinking Places, Educational Services, Accommodation, and Management of Companies & Enterprises. Combined these industries lost 7,344 jobs in the last year, accounting for almost half of all job losses in the region (see Figure 3).

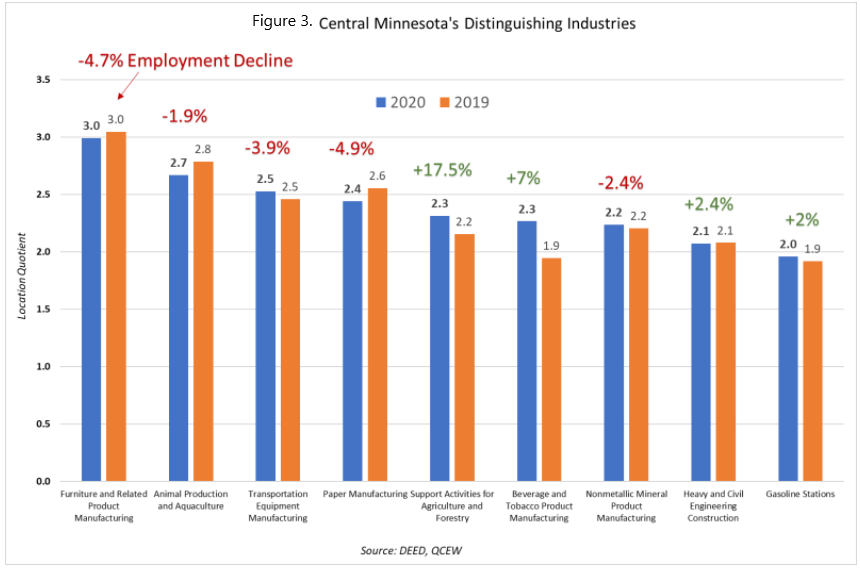
In response to the pandemic recession, Central Minnesota's industry employment shifted and changed, but the most distinguishing industries remained at the forefront of the regional economy. Identified by high location quotients, a location quotient (LQ) for a particular industry is a ratio that compares the percentage of employment in that industry in a local area to the percentage that same industry constitutes in a reference economy, in this case, the entire state of Minnesota.
Central Minnesota has its highest location quotients in Furniture & Related Product Manufacturing, Animal Production & Aquaculture, Transportation Equipment Manufacturing, Paper Manufacturing, Support Activities for Agriculture & Forestry, and Beverage & Tobacco Product Manufacturing. A location quotient of 2 or higher means they are at least twice as concentrated here as statewide.
The past year has been challenging for a number of industries, however, very few of those subsectors have high location quotients in the region. So while Central Minnesota was able to skirt losses from being heavily concentrated in the hardest hit sectors of the economy, most notably Leisure & Hospitality; employment still declined in over half of the most distinguishing industries. Indicated by the red percentages over the bar chart in Figure 1, six of the nine distinguishing industries are in the Manufacturing sector, and only Beverage & Tobacco Manufacturing saw gains from 2019 to 2020. Animal Production & Aquaculture and Paper Manufacturing declined in employment and had a lower LQ in 2020, meaning employment declined faster in the region than the state. Conversely, the majority of distinguishing industries held their market share of employment, meaning they declined slower than the rest of the state, or grew faster than the state overall (see Figure 4).

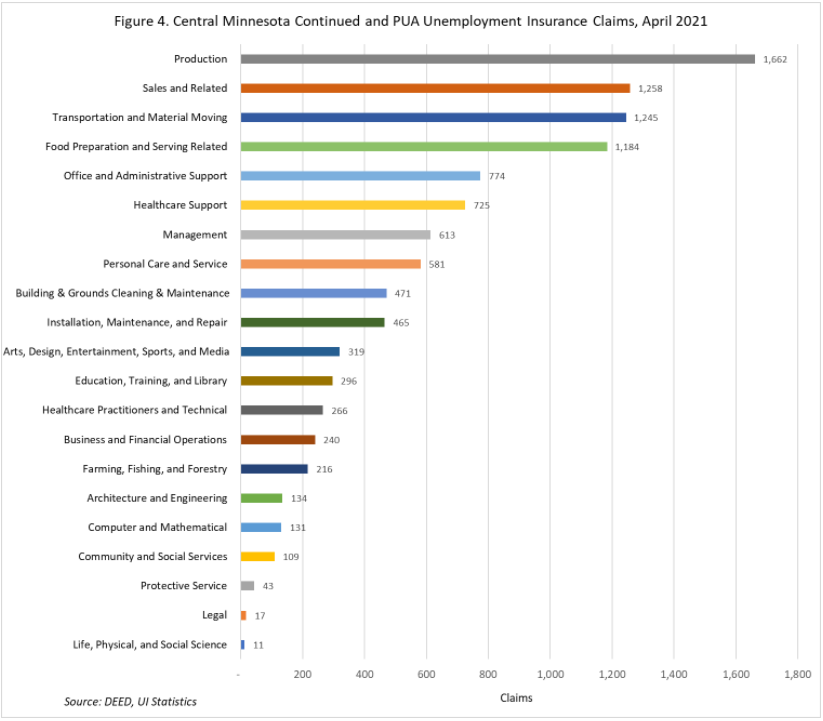
The most recent month of UI data is from April 2021,and this information provides insight as to who is most recently receiving UI benefits. Recipients of UI could be eligible from the loss of a job or a reduction in hours, or a combination if they hold multiple jobs. In April of this year 17,067 workers were receiving UI through regular continued claims or the Pandemic Unemployment Assistance (PUA) program, down from more than 60,000 a year prior, but more than double the number in April 2019.
If April 2019 is used as a benchmark, Central Minnesota still has over 9,000 more workers receiving UI in April of 2021 because of the pandemic. The Construction industry and occupational category is responsible for the largest number of claims in April, and since their numbers remained consistent with previous years (Construction workers are typically laid off during winter months), removing the category from the analysis provides a better picture of the effects of the pandemic.
Consistent with job losses highlighted in several Manufacturing subsectors in Figure 3, Production workers are filing more UI continued and PUA claims than any other occupational category, with 13% of claims from 1,662 workers. Sales and Transportation & Material Moving were the next most common types of occupations held by workers receiving UI in April. The largest amount of UI claims come from the "unknown" occupational category, the default when UI claimants do not self-report an occupation on the application. This category was omitted from Figure 4, which shows were claims are currently happening.
From the UI claims data we also know that the vast majority of claims were paid to men (62%), skewed by large numbers of claims from the male-dominated Construction Industry. After adjusting for the gender distribution in Construction, it's likely women filed a slightly larger share of claims in April than men due to the effects of the pandemic - that was certainly the case when looking at UI claims data from 2020.
Central Minnesota's economy was shaken by the pandemic, and while the hiring pace desired by employers has rebounded, the dust hasn't settled enough yet to truly grasp what's next for our economy and its workers post-pandemic.