
by Alessia Leibert
March 2020
Employment surpassed both public and for-profit sectors from 2012-2018, and there's opportunity for even more job growth.
Some of the largest and smallest employers in Minnesota are nonprofits. From world-renowned hospitals and universities to tiny local arts councils, nonprofit organizations contribute significantly to the economy and to society.
Nonprofits do not need to operate exclusively for philanthropic or charitable purposes. They can also operate for civic and environmental advocacy, social assistance, sport, entertainment, or any other purpose except for profit. Absence of a profit motive does not mean that nonprofits can't be highly profitable: In fact, they often are.
This article leverages Unemployment Insurance (UI) wage records data and drivers' license data to examine employment and earnings trends in Minnesota's nonprofit sector and to identify key workforce demographic characteristics.
|
Arrowhead Economic Opportunity Agency Blue Cross and Blue Shield of Minnesota Fairview Health Services Hazelden Betty Ford Foundation HealthPartners League of Women Voters of Minnesota Lutheran Social Service of Minnesota Mayo Clinic Medica Minnesota Association of Charter Schools Minnesota Association of Professional Employees (MAPE) Presbyterian Homes and Services Rural Renewable Energy Alliance St. Paul Academy and Summit School Twin Cities Public Television University of St. Thomas YMCA of the Greater Twin Cities |
In 2018, nonprofit jobs represented 13% of Minnesota employment. Health care makes up the lion's share at 59% of nonprofit jobs, followed by Social Assistance at 12%, and Education at 10% (Figure 1).
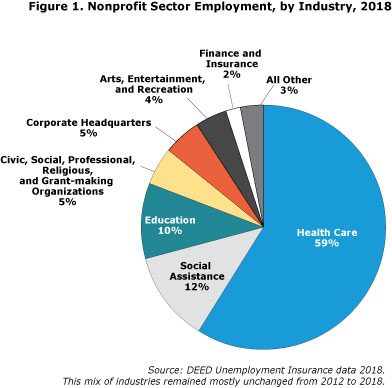
The impact of health care nonprofits on Minnesota's economy extends way beyond 59 percent. The largest nonprofit employers in health care are like cities, owning branches in all kinds of businesses including pharmacies, cafeterias, information technology services, orthopedic and surgical implants labs, medical insurance, and headquarters. The largest health care nonprofits, especially hospitals and clinics, hire for all kinds of occupations and have enormous purchasing power.
Ownership type makes no difference in the nature of the activities performed. For example, no difference exists between a nonprofit retail pharmacy and a for-profit retail pharmacy except for tax exempt status. Nonprofits are exempt from paying taxes1 because their profits (net earnings) are not returned to shareholders or any other individual but are held by the organization as reserve.
Civic, social, professional and grant-making organizations (5%) and arts, entertainment, and recreation organizations (4%) represent a smaller share of nonprofit jobs in Minnesota One reason for the smaller size is that these organizations rely heavily on unpaid volunteers, which are excluded from official employment statistics. Examples include museums, churches, nature centers, historical societies, and a multitude of philanthropic programs.
Finance and Insurance accounts for 2% of nonprofit jobs, mostly in health and medical insurance organizations. The last category, All Other Industries, encompasses a wide variety of professional activities, from electrical cooperatives to retailers of donated clothes. The nonprofit sector contains a remarkable kaleidoscope of activities.
About the DataThis study adopts the IRS definition of nonprofit organizations, according to which every organization with tax-exempt status under section 501(c)(3) of the Internal Revenue Code is considered a nonprofit. Employment and earnings outcomes are only for individuals who work in Minnesota as identified in administrative records of the state's Unemployment Insurance (UI) program. Although 97% of Minnesota businesses report wages, people who are self-employed or employed out of state are not covered by Minnesota's UI laws and therefore are not captured in wage results. |
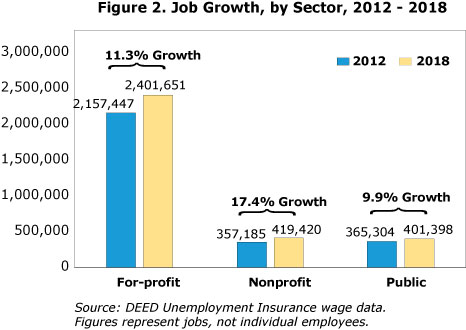
More Minnesotans are finding jobs in a nonprofit. From 2012 to 2018, the number of nonprofit jobs surpassed the public sector, growing on average by 17.4% (Figure 2). Health care services is a major driver of this growth.
The number of nonprofit organizations has grown steadily, rising from 4,992 to 6,195 between 2012 to 2018. Fifty-eight percent of Minnesota nonprofits employ fewer than five employees.
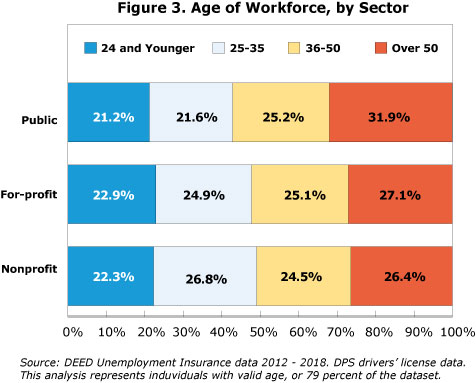
The nonprofit sector relies on a younger workforce relative to other sectors (Figure 3). In 2015, about 49.1% of nonprofit workers were 35 and younger, as compared to 47.8 and 42.8 in the for-profit and public sectors. Nonprofits offer plenty of opportunities for teens and college-age job seekers, including recreational summer camps, youth sports clubs, cooperatives, and organizations with a humanitarian or charitable purpose that may appeal to the idealism of younger workers.
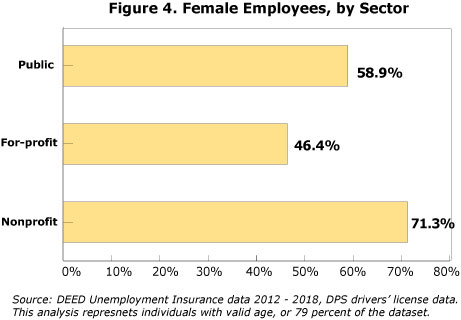
The nonprofit workforce is strikingly female dominated. Women represent nearly three out of four (71%) nonprofit employees (Figure 4). One likely reason why women make up such a large share of nonprofit employment is the high percentage of nonprofit jobs that are in female-dominated occupations in the health care, social assistance and education fields.
More gender-equitable compensation is another possible reason why the nonprofit sector attracts more women. Looking at workers ages 30 to 45, we find that women's wages in the nonprofit sector are closer to men's wages compared to the for-profit sector. This was true both at the median wage and at the 80th percentile wage – which is the highest 20% of salaries, earned by workers with higher seniority or in leadership roles (Figure 5). This is partially driven by hospitals, which in Minnesota are almost entirely owned by nonprofits2 and where women have good opportunities for career advancement. But even outside hospitals women earn more in the nonprofit than in the for-profit sector. An important caveat: These findings only represent aggregates. There are pockets in the nonprofit sector where women's wage disadvantage is larger than the aggregate measures shown in Figure 5.
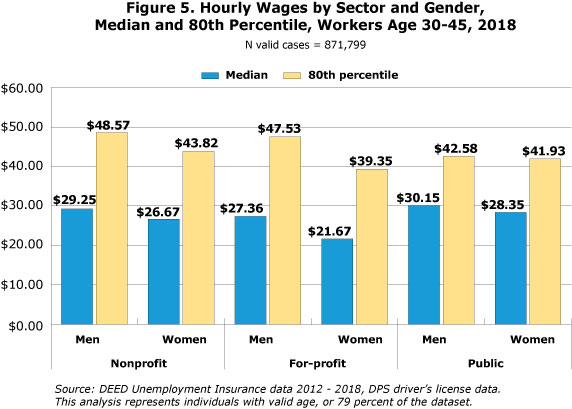
Unsurprisingly, the smallest gender gaps are found in the public sector where pay is more often governed by union contracts and other regulatory policies designed to prevent pay discrepancies based on gender, race and other characteristics.
Figure 6 plots median hourly wages by sector over time. The public sector, in total, has the highest median hourly wages ($26.06 in 2018) because it traditionally employs the oldest and most highly educated workforce3, including University of Minnesota and Minnesota State employees and managers. The for-profit sector has the lowest aggregate wages ($20.30 in 2018), mostly because it makes greater use of part-time schedules and employs more non-college educated individuals relative to other sectors, including minimum-wage workers in food services.
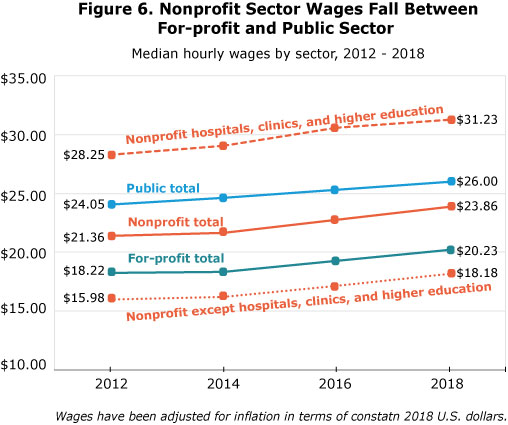
Median wages in the total nonprofit sector fall between the public and for-profit sectors. However, a different picture emerges when we separate out hospitals, clinics, and higher education from other nonprofit organizations. While wages in the first group surpass the public sector ($31.23 versus $26.00 in 2018), wages in other nonprofit organizations were only $18.00, lower even than in the for-profit sector.
What drives this polarization in earnings? Figure 7 gives some clues by breaking down nonprofit wages by industry. Finance and insurance paid median wages of about $34.21, the highest of any industry in the nonprofit sector, followed by hospitals and clinics. Colleges and universities rank fourth; nonprofit headquarters rank fifth. Wages in other industries are significantly lower.
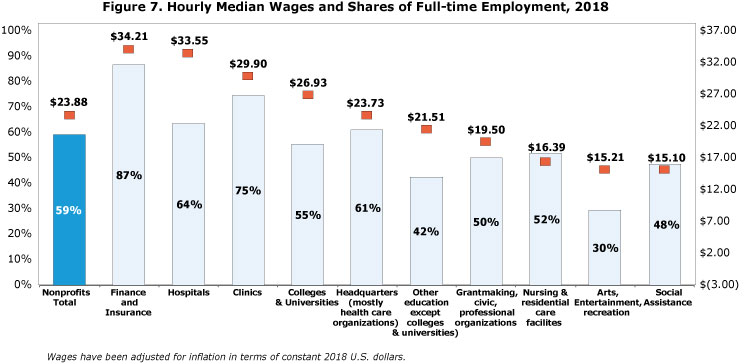
One possible explanation for these large wage disparities is the different use of full-time work, represented by the blue bars. Finance and insurance, hospitals, and clinics have the largest share of full-time employment, which contributes to career advancement and faster wage progression. Full-time work is also a measure of job quality because it typically grants access to retirement and health care benefits.
Moreover, high bonuses are more typical in finance and insurance, hospitals, clinics, and higher education than elsewhere. CEO compensation in the top 100 largest nonprofits is publicly disclosed online, but big salaries are not limited to CEOs. Using our wage measure, which includes all types of compensation (bonuses, stock options, severance pay), we found that 80th percentile wages – representing the minimum value for the top 20% of earners – are also quite high. In nonprofit finance and insurance organizations, it's $59.24; hospitals, $49.56; clinics, $52.11; and in higher education, $41.88.
These figures stand in sharp contrast to those in other nonprofit industries. For example, education except colleges and universities has a median wage of $21.51 and an 80th percentile wage of $32.04, indicating lower compensation even at high levels of job seniority and responsibility. This category includes private nonprofit and charter K-12 schools, cultural and religious learning centers, art and sports academies, and heritage language schools. Some of these organizations are financially supported by small grants or by families directly and rely on a predominantly part-time workforce.
The grant-making, civic, and professional organizations industry, dominated by small grassroots organizations, paid median wages of $19.50 per hour.
Finally, workers in nursing care facilities, arts, entertainment and recreation, and social assistance are the lowest paid in the nonprofit world. Low wages in arts and recreation are driven by extremely low shares of full-time employment (30%) and seasonal hiring. Low wages in nursing and residential care facilities and social assistance are primarily related to funding sources and customers' ability to pay. These industries include community, child and youth, elderly, and disabled services. Unstable funding sources make it hard for these nonprofits to afford and retain full-time staff, and the types of customer served are less able to pay the true cost of the service.4
In general, the lowest paying industries in the nonprofit sector also tend to be the lowest paying in the for-profit sector. However, there are exceptions. Nonprofit hospitals and clinics pay higher wages than their for-profit and publicly run counterparts. The reverse is true in social advocacy, emergency relief services, community housing/food services, and vocational rehabilitation services, where the nonprofit sector is associated with lower earnings.
This difference likely stems from the fact that nonprofits in these industries serve the highest-needs populations and lack coherent funding. For example, most nonprofit vocational rehabilitation services provide free job training to persons with disabilities and the unemployed, while many of their for-profit counterparts sell certified managed care plans.
These findings raise a broader issue. Low compensation levels in certain nonprofit organizations are often, though not always, an indicator of scarcity of resources. Many nonprofits are driven by the mission of filling gaps in services to populations that are either too poor to be profitable to serve by the for-profit sector or too unique and complex to be adequately served by public programs. These nonprofits operate in the front lines of the toughest social and medical problems – homelessness, mental illness, drug addiction, and poverty – yet they are asked to do more with less.
This study used newly available data to trace recent trends in the nonprofit workforce and increase our understanding of the sector's impact on the economy. To summarize:
Nonprofits contribute greatly to strengthening the fabric of our society. They help the poor and most vulnerable, provide opportunities to stay healthy, preserve local culture, protect the environment, and build a sense of community. As citizens, we all have a stake in nonprofits and a responsibility to help them fulfill their mission while holding them accountable for the favorable tax treatment and donations they receive.
1Some exceptions apply, such as property income and capital gains.
2In 2018, nonprofit hospitals represented 92% of total hospital employment in the state.
3Evidence on the effect of age and education level on wages by sector was tested through a subset of records for which information on worker demographics and educational characteristics is available. The test dataset includes 563,835 individuals who attended a post-secondary institution in Minnesota, left school between January 2009 and June 2016, and had a matching record in UI wage data three years after school exit (source: Statewide Longitudinal Education Data System). The results revealed that the public sector absorbs the relatively largest share of college-educated workers, the for-profit sector a smaller share, and the nonprofit sector falls between the other two. The nonprofit wage advantage over for-profits shrinks substantially after accounting for workers' age, education level, major, and job characteristics such as industry and region of work.
4Lower profitability is partially tied to the fact the rates of reimbursement for serving customers/patients are lower relative to those given to hospitals.