by Dave Senf
June 2018
Note: All data except for Minnesota’s PMI have been seasonally adjusted. See the feature article in the Minnesota Employment Review, May 2010, for more information on the Minnesota Index.
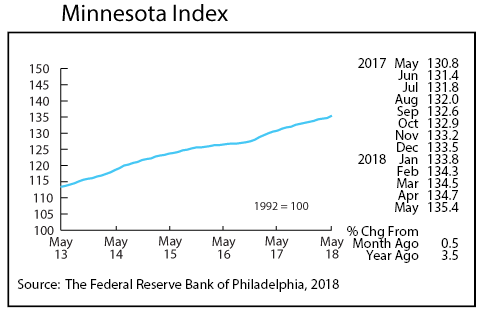
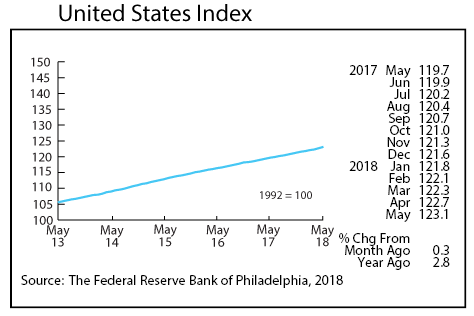
The Minnesota Index surged 0.5 percent in May, powered by robust wage and salary employment growth. The May increase was the largest since June 2017 and the 21st straight month of gains. After April’s weak reading, the solid rebound in May suggest that Minnesota’s late winter weather in April delayed the start of the usual seasonal hiring. May’s increase was also fueled by increasing average weekly manufacturing hours and a 0.1 decline in the unemployment rate. The last time that Minnesota’s seasonally adjusted unemployment rate was 3.1 percent was in July 2000, seven months before the 2001 recession began.
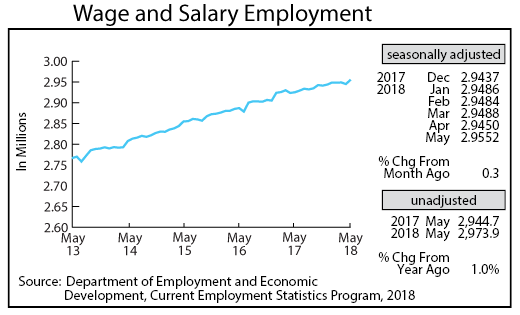
Minnesota’s adjusted Wage and Salary Employment rocketed up in May as employers added 10,200 jobs, the largest monthly hiring total since January 2017. Private sector hiring accounted for 9,900 of the job jump to go along with a 300 public sector jobs increase. All but two of the 11 super sectors added workers in May with hiring strongest in Professional and Business Services, Leisure and Hospitality, and Construction. Manufacturing also expanded its workforce, adding positions for the fifth month in a row. Only Educational and Health Services cut jobs while employment in Financial Activates held steady in May.
Minnesota’s unadjusted over-the-year job growth accelerated to 1.0 percent in May, a welcomed improvement over the 0.3 percent increase in April. Through the first five months of 2018 Minnesota’s unadjusted over-the-year job growth has average 0.7 percent which is almost half the 1.3 percent rate recorded over all of 2017. The U.S. over-the-year rate stayed at 1.7 percent for the third consecutive month.
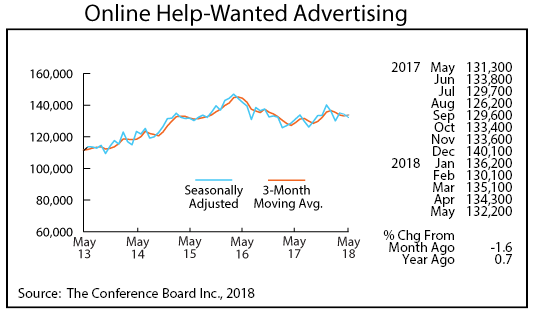
Online Help-Wanted Ads inched down for the second month in a row to 132,200. Minnesota’s job postings slipped 1.6 percent while nationwide postings declined 1.1 percent. Minnesota’s share of U.S. online job postings stayed at 2.8 percent and continues to be higher than the state’s 2.0 percent share of wage and salary employment. The state’s unemployed-workers-to-online-help-wanted-ads ratio in May, as reported by the Conference Board, was 0.74, the third lowest ratio behind Hawaii and Colorado. The national ratio was 1.34. Unemployment rates for Hawaii and Colorado in May were 2.0 and 2.8 percent. Minnesota unemployment rate is likely to fall below 3.0 percent before 2018 ends.
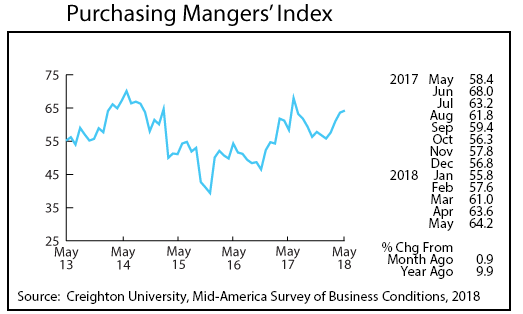
Minnesota’s Purchasing Managers’ Index (PMI) rose for the fourth consecutive month, climbing to an 11-month high of 64.2. The upward direction of the index over recent months suggests that Minnesota’s Manufacturing activity should continue to pick up over the next three to six months. The comparable national index increased to 58.7 while the Mid-America Business Conditions Index, which includes Minnesota and eight other states stretching from Arkansas to North Dakota, spiked to 67.3, the highest reading in 14 years.
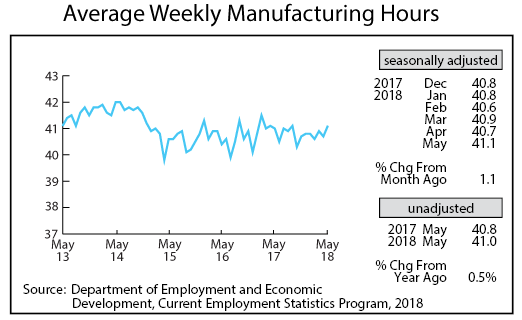
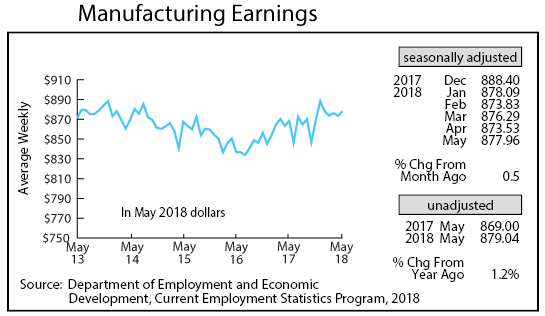
Adjusted average weekly Manufacturing Hours rose sharply in May, climbing to 4.1, its highest level since last September. The uptick in the factory workweek is consistent with Manufacturing activity picking up across the state. Average weekly Manufacturing Earnings, adjusted for inflation and seasonality, strengthened in May to $988.96. Real Manufacturing paychecks unadjusted for seasonality were up 1.2 percent from a year ago. Real Manufacturing earnings have increased for 17 straight months.
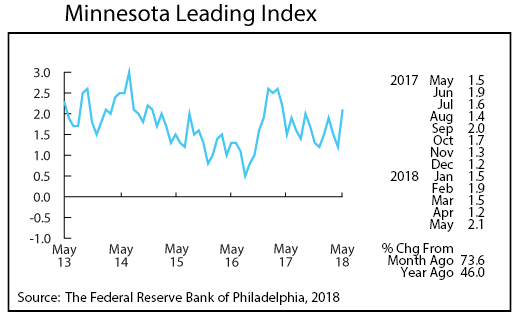
The Minnesota Leading Index advanced sharply in May to 2.1 after having slipped the previous two months. May’s reading is the highest since last April and higher than the 1.5 U.S. reading. The average reading since 1982 is 1.5 so the 2.1 May index suggests that Minnesota’s economy will be expanding at a faster rate than usual over the next six months.
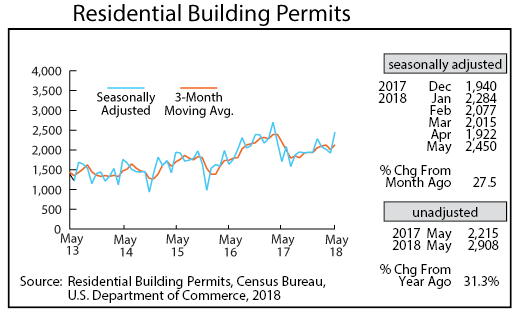
Adjusted Residential Building Permits shook off the state’s late winter weather in May by jumping to 2,450, the highest level since March 2017. Home-building permits through the first five months of 2018 were down 12.6 percent from the same period a year ago. Annual home-building permits through May were 7,100 in 2016, 9,600 in 2017, and 9,300 this year.
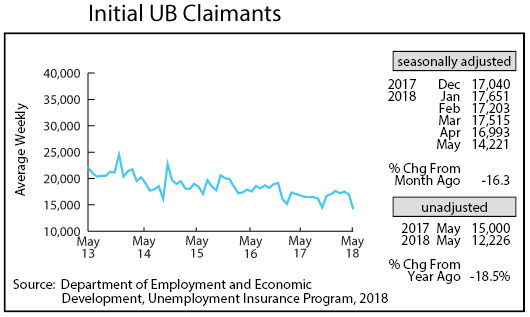
Adjusted Initial Claims for Unemployment Benefits (UB) nosedived in May, falling to its lowest level in 20 years. May’s extremely low 14,221 initial claims set an all-time record low as a percent of total wage and salary employment. For every 10,000 wage and salary jobs there were 48 initial claims for unemployment benefits in May. The monthly average since 1970 is 99 initial claims for every 10,000 wage and salary job. The record low is just another indicator of how tight Minnesota’s labor market has become.