by Nick Dobbins
December 2019
Million-dollar employees in Minnesota make over 3 percent of all wages.
In 2018, 2,343 people in Minnesota were paid $1 million dollars or more in wages. While these million-dollar workers represented just 0.08 percent of the total jobs in the state, they accounted for 3.32 percent of all wages paid. Using DEED’s Quarterly Employment Demographics data, this article will look at those Minnesotans who were paid over a million dollars, exploring who they are, where they work, and how their cohort has changed in the past 15 years.
Demographically, most of the million-dollar employees in Minnesota are men, by a margin of 73 percent to 27 percent. While large, this represents a significant closing of the overall gender gap, as the 2003 margin was an even wider 86 percent to 14 percent. The cohort has also gotten older over the past 15 years, as the average age has moved from 49.2 to 52.9 years old.
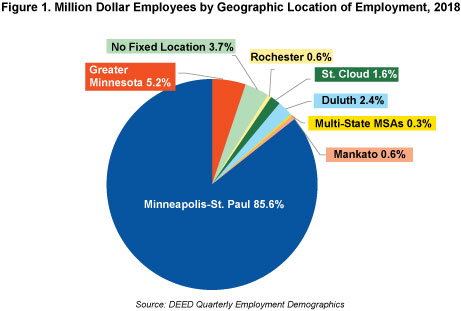
Geographically, labor in general is concentrated in the metro area. Sixty-five percent of all jobs are in the 11 Minnesota counties of the Minneapolis-St. Paul metropolitan statistical area. As Figure 1 shows, this effect is even more pronounced at the highest wage levels. Nearly 86 percent of million-dollar jobs are in the Twin Cities metro. That number jumps to over 89 percent when we include jobs in the ‘no fixed location’ classification, most of which are in either Wholesale Trade or Consulting Services and take place at a variety of locations but are likely primarily located in the metro.

While just 2,343 Minnesotans were paid over a million dollars in 2018, this represents significant growth over previous years. In 2003, only 878 people made the cut, and they collected 1.9 percent of the total wages paid. The number of people and the proportion of all wages in this employment cohort have been on a relatively consistent upward trajectory for the past 15 years, save for a dip surrounding the 2009-10 recession.
These well-paid employees also tend to be distributed even higher on the wage curve than the relatively arbitrary cutoff might suggest. While we refer to them as ‘million-dollar employees’ here, their average wage was over $2.37 million, with a median wage of $1.47 million. Moving even higher up the distribution, 59 Minnesotans were paid more than $10 million. Their combined pay represented 0.6 percent of all wages paid in the state in 2018.
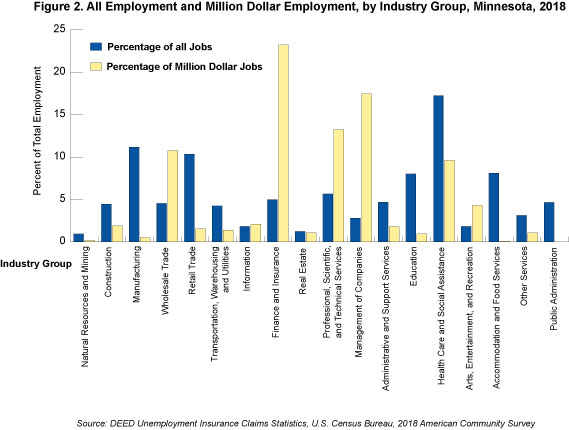
Million-dollar jobs are concentrated in a small number of industries. As Figure 2 shows, over half could be found in one of three groups: Finance and Insurance (23.2 percent), Management of Companies (17.5 percent), and Professional, Scientific, and Technical Services (13.2 percent).

The source of the largesse in two of these is clear. The Finance and Insurance industry group includes banks, investment and brokerage firms, and other organizations that manage large sums of money for clients, and they are evidently highly compensated for it. Management of Companies clearly involves firms primarily engaged in managing companies, which includes corporate headquarters. Minnesota is home to the headquarters of several large corporations, including 19 members of the 2018 Fortune 500. It’s likely you would find several c-suite employees from those firms among the million-dollar employees.
The source of high-wage jobs in Professional, Scientific, and Technical Services, is less obvious. While the industry group is home to engineering, law, architectural, and accounting firms, none of those industries contributed greatly to this cohort. The plurality of people on our list from the Professional, Scientific, and Technical Services group is found in the relatively small Management Consulting Services industry. While the industry has rapidly expanded in the past 15 years, more than doubling its employment in that time, it still accounts for less than 1 percent of all jobs, but 5.7 percent of million-dollar jobs.
Of the 18 industry groups included here, 12 contributed proportionally fewer million-dollar jobs than total jobs. Some of the largest disparities came in the largest industry groups. Manufacturing, Retail Trade, and Accommodation and Food Services accounted for 11.2, 10.4, and 8.1 percent of all jobs in the state, respectively. The same three industry groups contributed just 0.5, 1.5, and 0.09 percent of million-dollar jobs, respectively.
While the public sector accounts for over 13 percent of all jobs in the state (or 384,615 jobs), only eight government employees qualified for this list. None were found in the Public Administration industry group, making it the only one in the state without representation on this list.