by Dave Senf
April 2016
Note: All data except for Minnesota’s PMI have been seasonally adjusted. See the feature article in the Minnesota Employment Review, May 2010, for more information on the Minnesota Index.
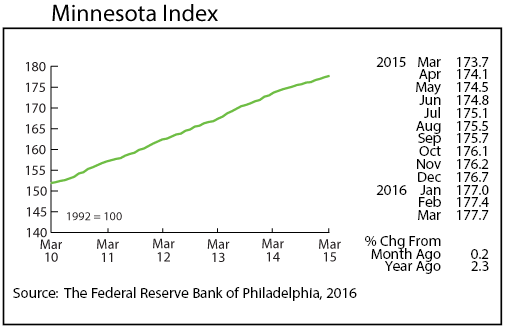
The Minnesota Index advanced 0.2 percent in March for the third straight month. The index, estimated by the Federal Reserve Bank of Philadelphia, combines four state-level indicators to summarize current economic conditions into a single statistic. The components of the index are nonfarm wage and salary employment, average weekly manufacturing hours, the unemployment rate, and wage and salary disbursements adjusted for inflation. The index is designed to be a monthly proxy for the state’s gross domestic product (GDP).
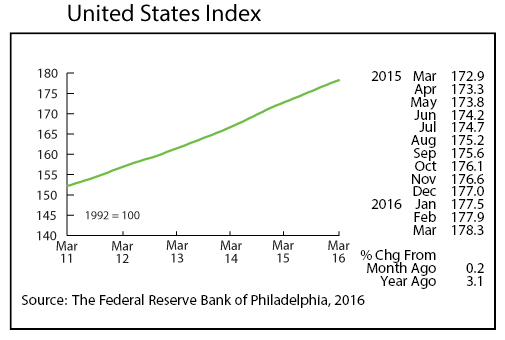
Minnesota’s monthly change has averaged 0.3 percent since 2010, so the 0.2 percent increases since the start of the year suggests that Minnesota’s economy has gotten off to a slow start in 2016. The U.S. Index is telling a similar story with the national index having increased 0.2 percent during the last two months. Minnesota’s index is up only 2.3 percent from a year ago while the U.S. Index increased 3.1 percent over the same period.
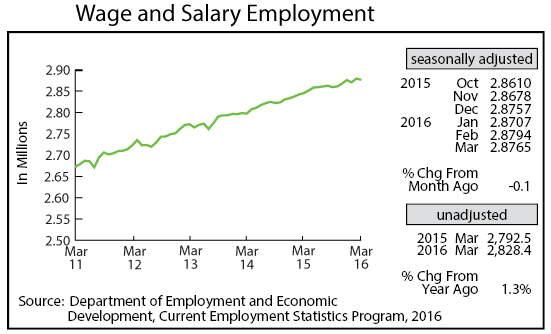
Adjusted Wage and Salary Employment dropped by 2,900 jobs in March with the majority of job loss occurring in the private sector. Job cutbacks were highest in Educational and Health Services, Construction, Leisure and Hospitality, and Other Services. Solid job gains occurred in Professional and Business Services and in Manufacturing.
Minnesota’s unadjusted over-the-year job growth rate slipped to 1.3 percent in March compared to the U.S. 2.0 percent rate. Minnesota’s job growth, after outpacing the national rate between 2008 and 2011, has been lagging behind U.S. job growth in three of the last four years including the last two. Minnesota’s annual job growth has outpaced U.S. growth 60 percent of the time since 1950. The state’s job growth has fallen below the national pace for two or more years three times: 1980-1983, 1997-1999, and 2004-2007.
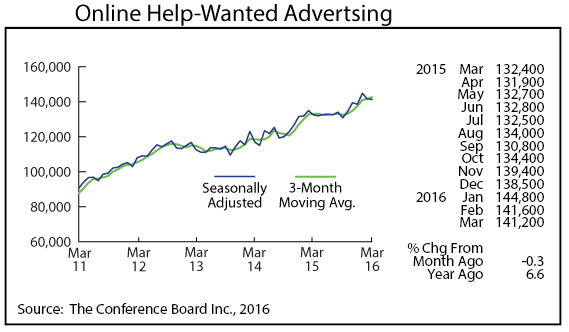
Online Help-Wanted Ads slipped slightly in March, declining 0.3 percent to 141,200. U.S. online job advertising also dropped, falling 0.6 percent. Minnesota’s percent of online help-wanted ads inched up to 2.75 percent in March, reaching its highest level since the Conference Board began reporting online help-wanted advertising numbers in May 1995. High online job advertising in Minnesota is probably a combination of two factors: demand for workers remains strong while worker supply is tight relative to the demand. Minnesota employers are likely having a harder time filling their job openings compared to employers in other parts of the country where the pool of unemployed workers is higher. This may explains why Minnesota has such a high share of online job advertising yet trails the nation in job growth.
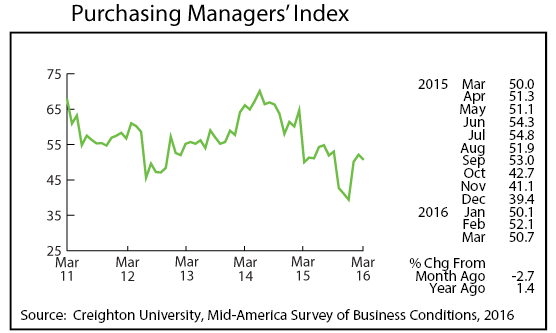
Minnesota’s Purchasing Managers’ Index (PMI) dipped a tad in March, sliding to 50.7. The index, produced by Creighton University as part of their Mid-American Business Conditions Index, offers a monthly reading on the state’s manufacturing sector. A reading above 50 indicates expanding manufacturing activity while a reading below 50 indicates contracting manufacturing activity. After averaging a record-high in 2014 the index plunged in 2015 and has yet to recover. Minnesota’s PMI index has been higher than March’s reading 70 percent of the time since Creighton University began reporting the index in 1994.
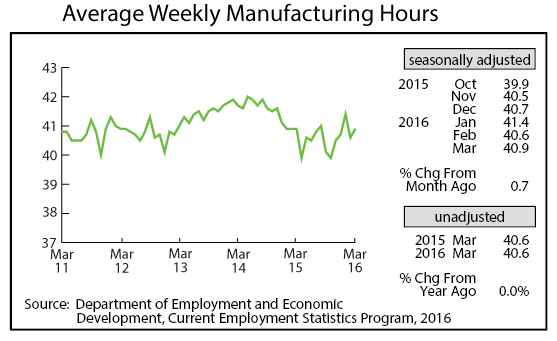
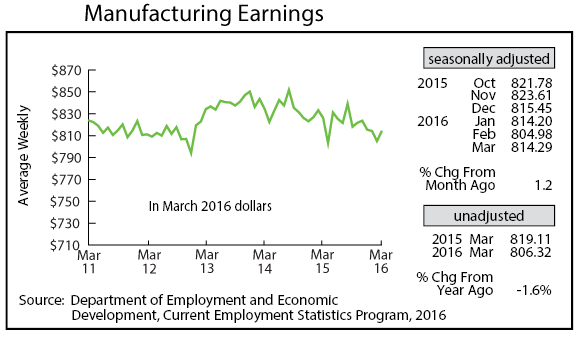
Adjusted Manufacturing Hours made up some lost ground in March but remained sluggish compared to two years ago. Minnesota manufacturers set a 45-year annual average weekly manufacturing hour mark in 2014 before dropping off sharply in 2015. The factory workweek so far in 2016 shows no sign of regaining its lofty 2014 level. Average weekly Manufacturing Earnings increased for the first time in four months in March but, like hours, remain low compared to the last two years.
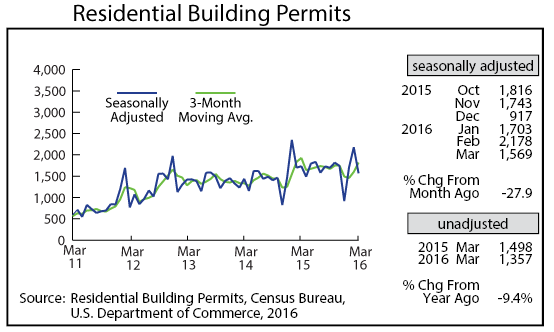
Adjusted Residential Building Permits slid in March after jumping to their highest level in over a year in February. Through the first three months building permits are down 5.8 percent from the same period last year but expect the Minnesota’s home builder market to have another year of moderate improvement, just like in 2015.
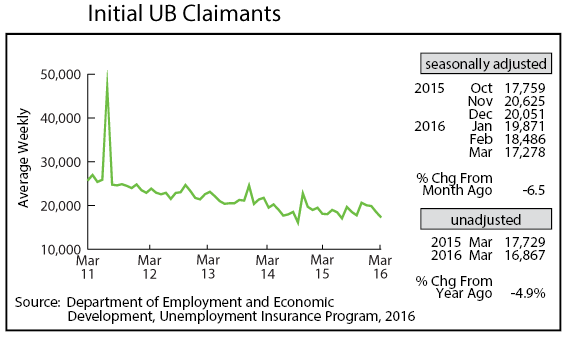
Adjusted Initial Claims for Unemployment Benefits (UB) inched down for the fourth month in a row, falling to its lowest level since last October. The 17,278 initial claims in March represent 0.6 percent of the 2.9 million wage and salary workers in Minnesota. The only time initial claims have been a smaller percent of total employment was during the 1997 – 2000 period when unemployment slipped below 3 percent. Over the last 45 years initial claims have average 1.0 percent of total employment. Finding new employees will remain tough for Minnesota employers given the low layoff rate (low initial claims level) and high demand (high online help-wanted ads) for workers.
