
by Alessia Leibert
December 2023
How long do Minnesotans stay in their jobs? In which industries are they likely to spend longer periods of their career? Does longer tenure with the same industry and employer translate to higher wages over time? This analysis explores the factors that influence workers’ decision to stay or leave a job and identifies industry sectors that have been most and least successful at retaining employees.
This study tracks a cohort of 1,914,489 Minnesotans who were employed for at least one quarter in 2022 and earned at least $800 over the year. Wage records for this cohort were then linked for all preceding years going back to 2004. Finally, these records were grouped to measure years of industry and employer tenure, based on the number of quarters for which a worker was employed. This study partially replicates, with adaptations, a 2010 study by Thompson and Justis1.
Figure 1 shows that Minnesotans of prime working age (20 to 55) spent a median of 5.5 years in the industry sector that employed them in 2022 (grey bars), and 3.3 years with the same firm2 (green bars). Median tenure is the point at which half of workers had more tenure and half had less tenure. Both measures of tenure increase with age. The oldest workers in our dataset (50 to 55 years old) had four times longer industry tenure than the youngest workers, 11.5 versus 2 years. This is not surprising, given that older workers have spent more time in the labor market3. It is also the reason why employer tenure follows the same pattern as industry tenure, growing steadily with age.
Figure 1
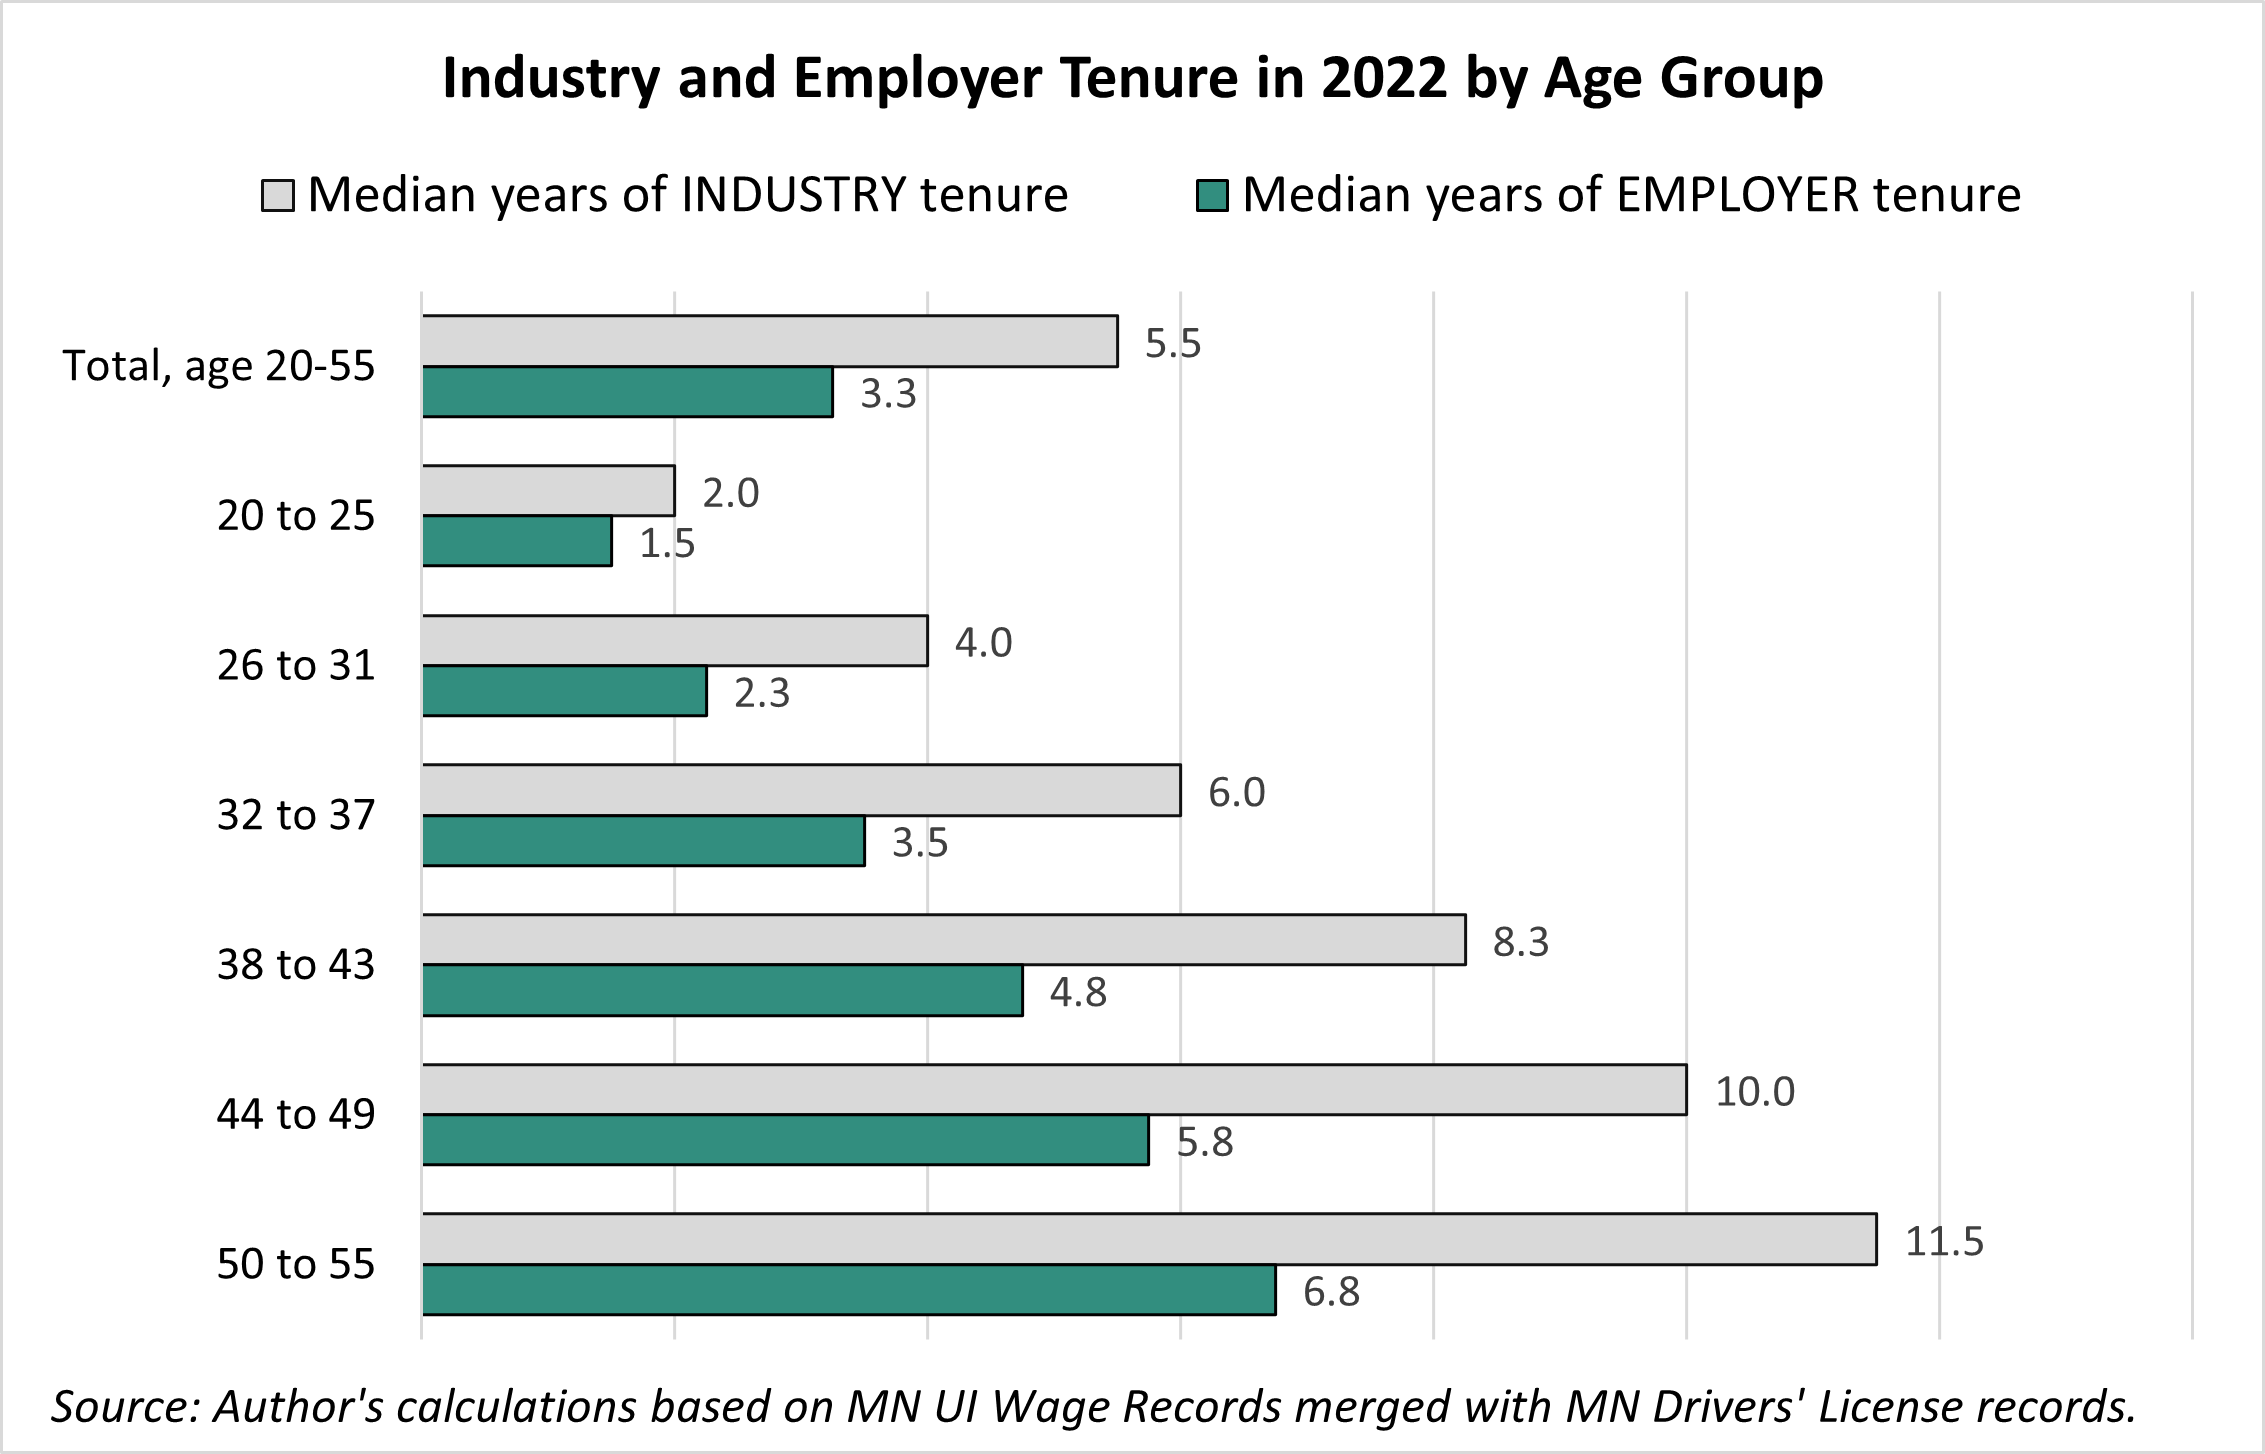
Workers under age 32 have the lowest employer tenure, both because they are newer to the labor market and because they are more likely to be working in jobs in which they do not intend to make a career.
Figure 2 summarizes industry and employer tenure by industry sector. The sectors where Minnesotans had the longest median industry tenure are Mining & Utilities, Elementary & Secondary Schools, Finance & Insurance, and Government, with a median of 7.5 years and above. These are also the industries with the oldest workforce in Minnesota4.
Figure 2
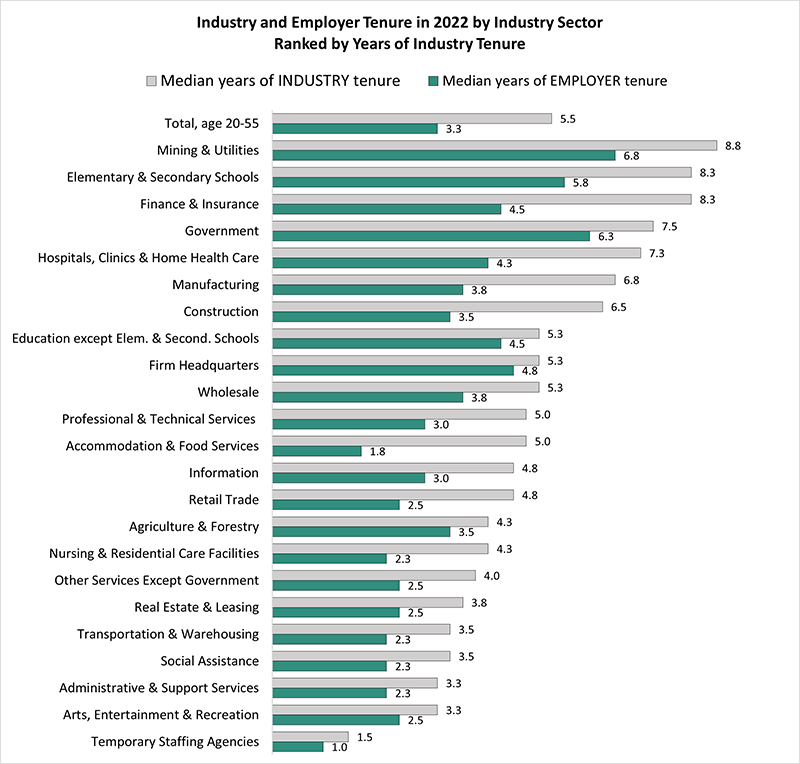
At the opposite side of the spectrum, Social Assistance, Administrative & Support Services, Arts, Entertainment & Recreation, and Temporary Staffing Agencies had the lowest industry tenure, suggesting high levels of turnover. Workers may seek employment in these sectors in times of transition, or may enter these sectors in hopes of building a career but are then discouraged to do so. For example, a college student could be working part-time as a Personal Care Aide (within Nursing & Residential Care Facilities) or in a summer camp (within Arts, Entertainment & Recreation) and decide to leave the industry after graduation to pursue better paid employment. As for Temporary Staffing Agencies, low industry tenure is the result of short-term work arrangements and overall low job quality5 in the sector.
Employer tenure typically follows the same pattern as industry tenure, but with notable exceptions. The Mining & Utilities sector stands out for its high levels of tenure not only within the industry (8.8 years) but also with the same employer (6.8 years). Utilities is also one of the most unionized industries6, a factor that might provide longer-term wage growth and better working conditions than other industries and thus encourage workers to stick around longer.
Six sectors show large gaps between industry tenure (grey bars) and employer tenure (green bars): Finance & Insurance, Construction, Manufacturing, Accommodation & Food Services, Retail Trade, and Nursing & Residential Care Facilities. Employer tenure in these sectors is nearly twice as short, or even shorter, than industry tenure. The fact that workers stayed twice as long in the same industry than at the same firm indicates a tendency to switch employers frequently within the same industry. There are at least three main reasons for this result. First, these industries employ a relatively young workforce, and we know from previous research that young workers switch between employers more frequently than others. Second, the nature of the jobs in some of these industries —especially Accommodation & Food Services and Retail Trade —is seasonal or temporary and returning to the same employer is often not possible nor desirable. Third, wages and working conditions can vary significantly within these sectors. Within Construction and Nursing & Residential Care Facilities, for example levels of unionization, workforce safety, and wages vary by subsector7. Poaching, or the practice of recruiting an employee from a competing firm, can be especially fierce within Manufacturing, where previous on-the-job training and industry-related experience is extremely valuable to employers.
By contrast, the difference between industry and employer tenure is minimal in Government, Education Except Elementary & Secondary Schools (which includes colleges and universities), and Firm Headquarters. This finding is correlated with firm size. School districts, government agencies, and corporate headquarters are large enough to offer their workers more opportunities to move within the firm, thus lowering turnover.
In conclusion, short tenure in an industry can pose a challenge for all employers in the industry, by shrinking the pool of qualified labor to recruit from. Short employer tenure is also problematic, because it can swell the costs of recruiting and training new hires.
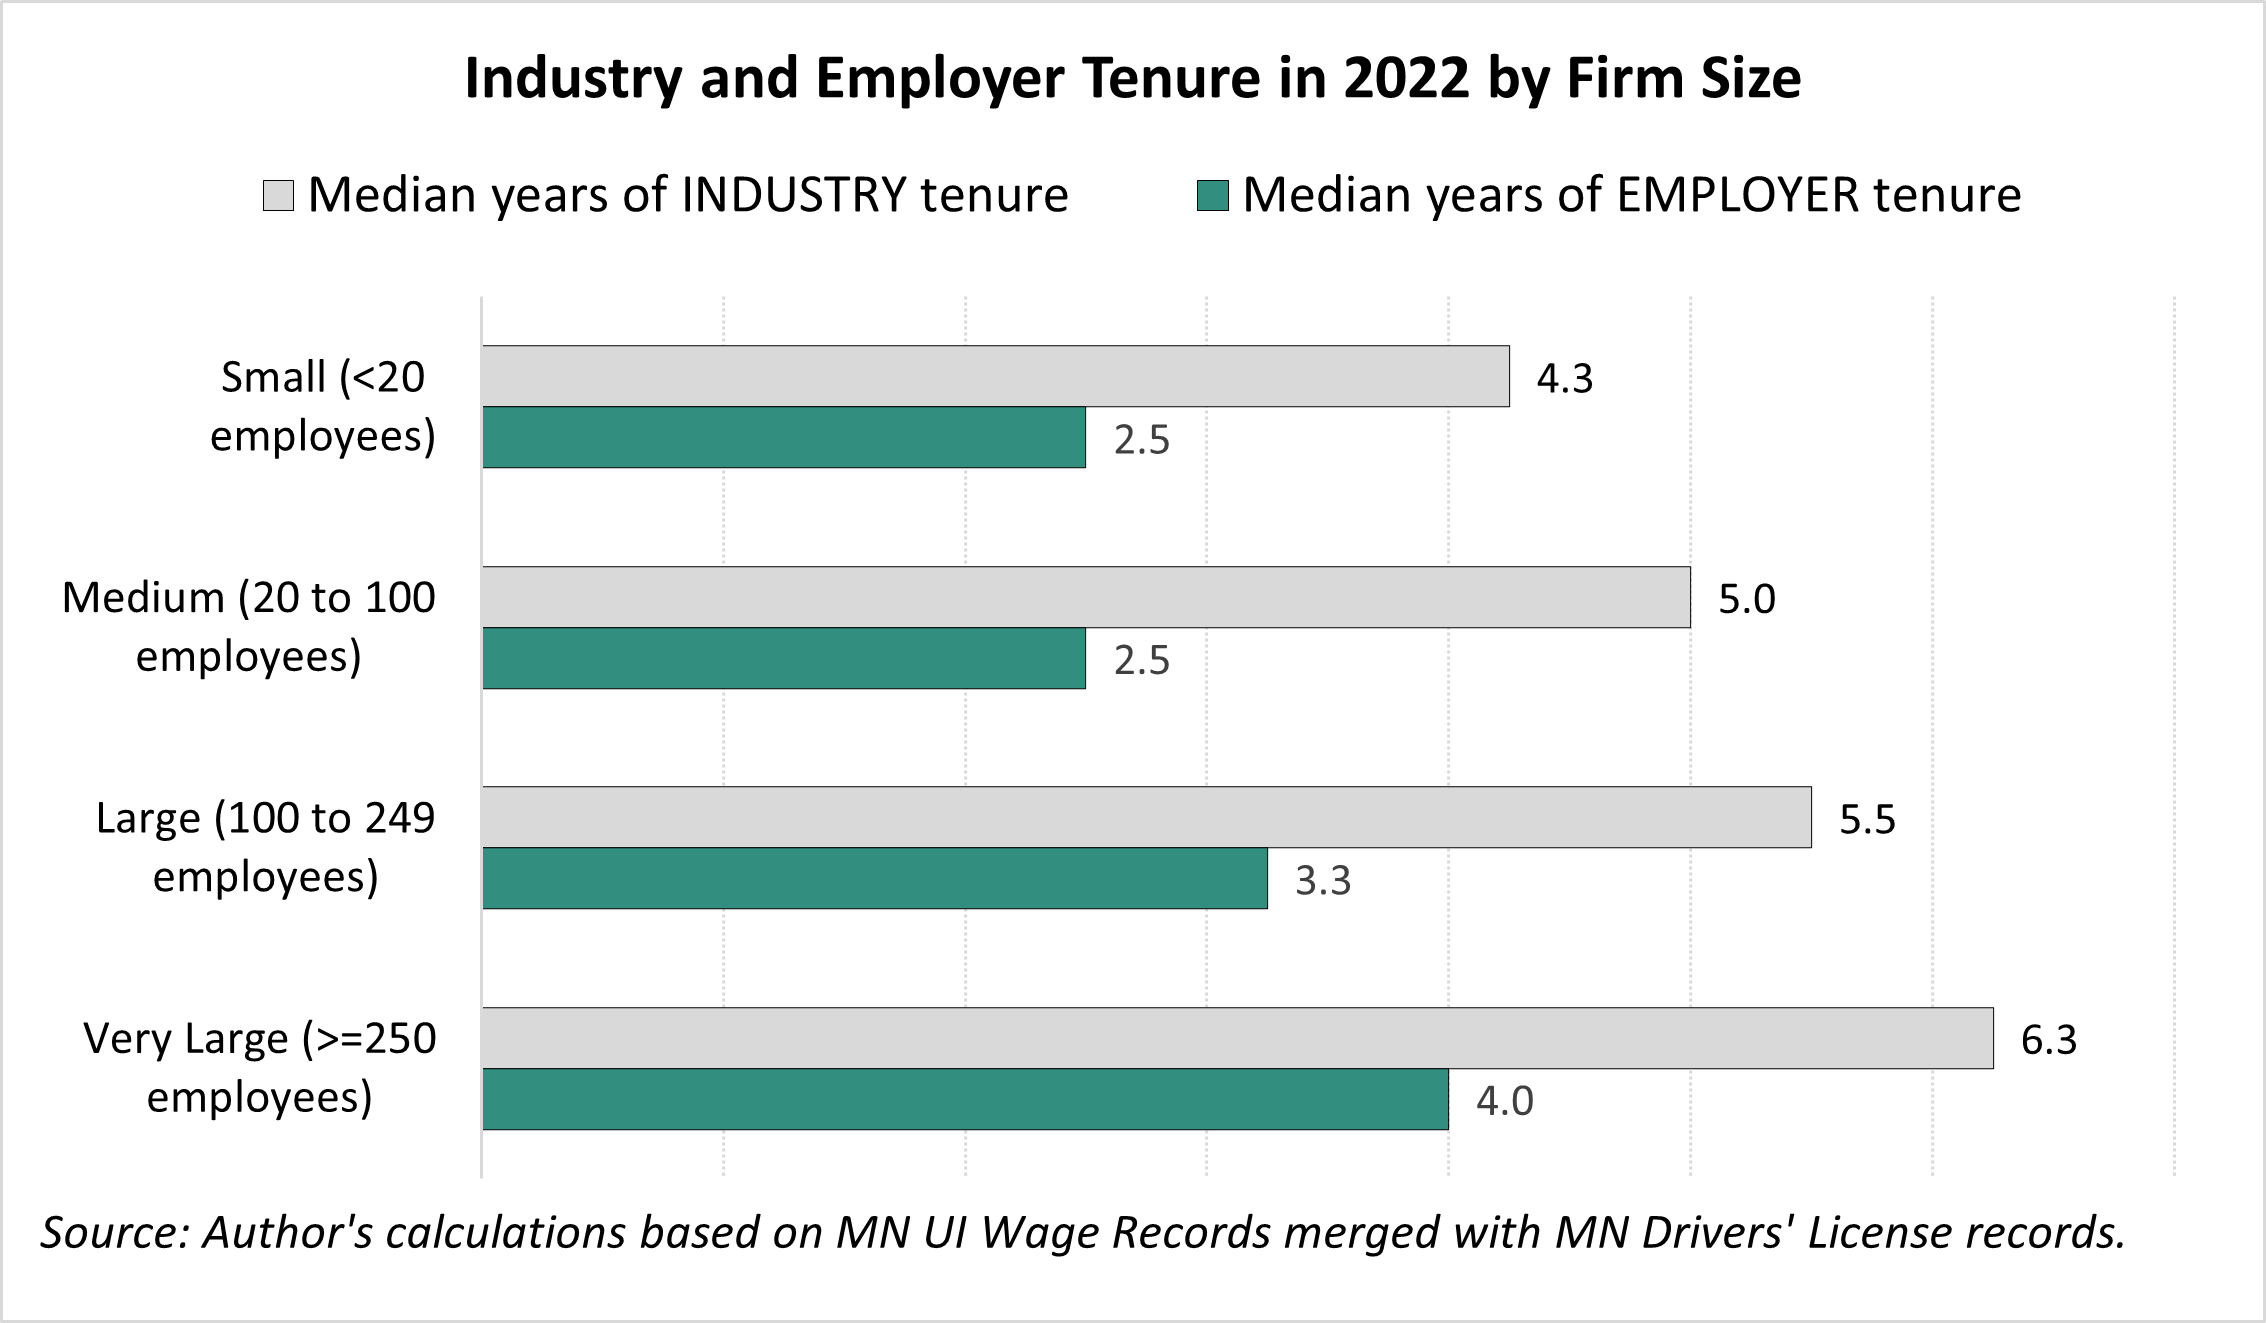
Figure 3 confirms the strong connection between tenure and firm size. Workers in small firms are more likely than others to be short-tenured. In contrast, workers in very large firms choose to spend longer periods of their careers within the same industry and firm, primarily because these firms can offer internal career ladders and have more resources to invest in employee training and retention.
Figure 3
To better understand which factors might drive a worker's decision to stay or leave, Figure 4 examines the relationship between years of tenure and wages. Workers with 2 to 5 years of service to their industry (solid blue line) earn more than those with 2 years or fewer years. These rewards keep growing over time up to 11 years, when growth starts slowing down.
Figure 4
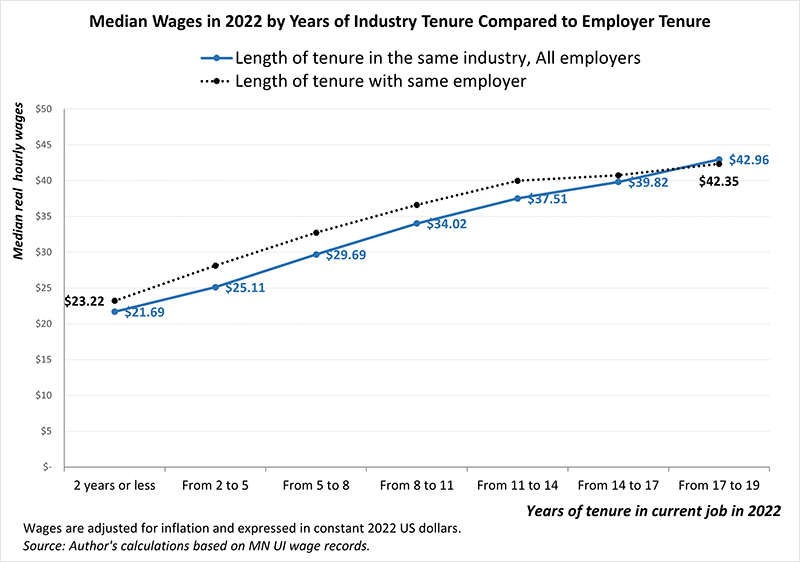
Tenure with the same employer (dotted black line) leads to higher wages than overall industry tenure up until 14 years of service. Beyond that point, the two wage lines converge. This evidence suggests that at higher levels of seniority the financial benefit from employer loyalty may fade away.
Work experience in an industry is a powerful mechanism for career advancement and wage growth. When recruiting, employers often value industry-specific experience more than postsecondary education, as previous studies demonstrate8. The financial rewards from spending more of one's career within an industry can shape the decision to stay or leave.
Figure 5 shows that, overall, workers with the most seniority in an industry (15 to 19 years) earned a median wage of $41.87. Comparing these wages to those earned by the shortest-tenured workers results in a difference of 93%. This figure represents the overall premium from longer service in one industry. However, this number varies by industry. For example, despite the similarity in entry-level wages between Retail Trade and Accommodation & Food Services ($16.64 versus $16.87), Retail Trade offers better wage growth prospects (69%) to workers who remained within the sector. In Accommodation & Food Services, the difference in earnings between the lowest and the highest tenure category is only 53%.
Figure 5
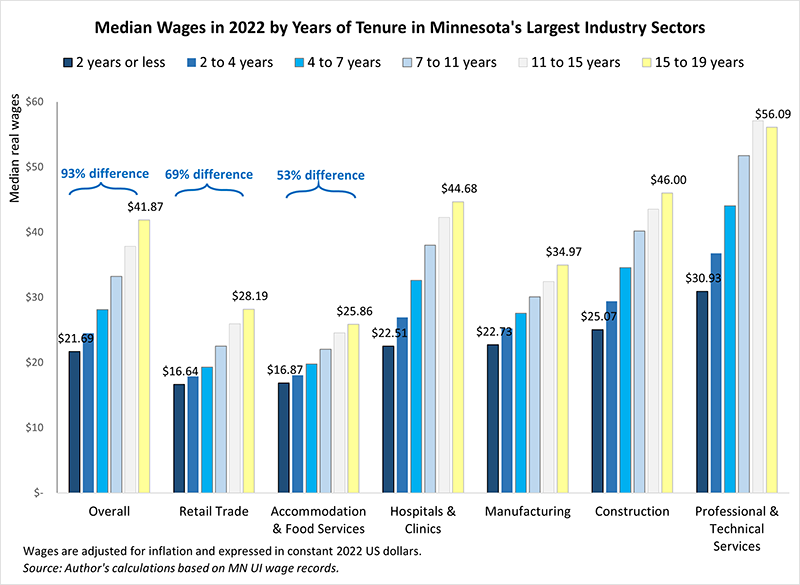
This evidence suggests that the reason workers stick around in certain industries more than others is not only starting wages, but also wage progression, indicating career advancement prospects.
Professional & Technical Services stands out for its high entry level wages: workers with barely 2 years of experience in the industry earned $30.53, in part because of high educational requirements and an older average age of industry entry. Industry seniority pays off, as shown by the fact that employees with 15 to 19 years of service9 in the industry earned a median wage of $56.09.
The premium from longer tenure in Manufacturing (54%) is lower than in Hospitals & Clinics (98%) despite the nearly identical entry-level wages. What may be driving this result? Figure 6 zooms into six Manufacturing subsectors, revealing that the increase in wages with tenure is much more pronounced in Chemical Manufacturing and Computer & Electronic Products Manufacturing than in other Manufacturing subsectors. The premium is lowest in Food & Beverage Products Manufacturing (40%). Because some of the largest subsectors10 offer the lowest premium they bring down the overall wage premium in Manufacturing.
Figure 6
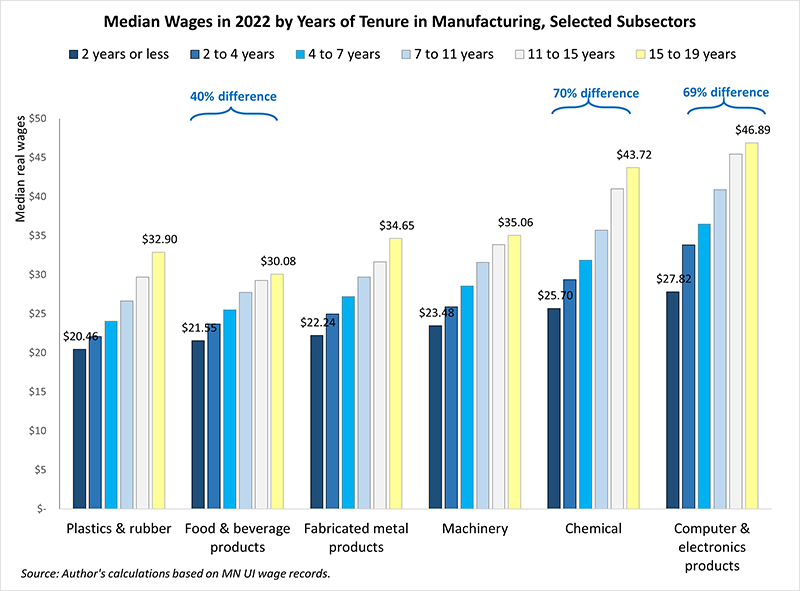
The subsectors with lowest starting wages- Plastics & Rubber Products and Food & Beverage Products Manufacturing— have the shortest median industry tenure, 5.2 and 5 years respectively. They also have the shortest employer tenure: Half of all workers in Plastics & Rubber Manufacturing had been with the same employer only 2.5 years, while half of workers employed in Food & Beverage Products Manufacturing stayed with the same employer only 3 years.
This evidence signals a problem with turnover in these lower-skilled subsectors of Manufacturing. Other factors unrelated to wage, such as physically demanding work conditions, inconvenient shifts11, and lack of options for remote work might also discourage workers to grow a career in these specific subsectors. Underpinning this result is the fact that retention is less relevant to competitiveness in low-skilled sectors than in high-skilled sectors, because workers can be trained in a short period of time and are easier to replace when they leave.
In conclusion, a worker's choice to stay or go is shaped by multiple factors. The most basic motivating force is the expectation of long-term income growth, which is a combination of wage levels, wage growth trends, and overall job stability. But wages and job stability are just one side of the equation. On the other side of the equation are a host of other factors related to job quality.
Figure 7 displays 21 industry sectors, rank-ordered by median years of employer tenure (blue bars) replicating the information presented in Figure 2. The chart also compares wages earned by short-tenured workers (2 years or less) with those earned by medium-tenured workers (8 to 11 years with the same employer) to examine the relationship between starting wages, wage growth, and length of tenure.
Figure 7
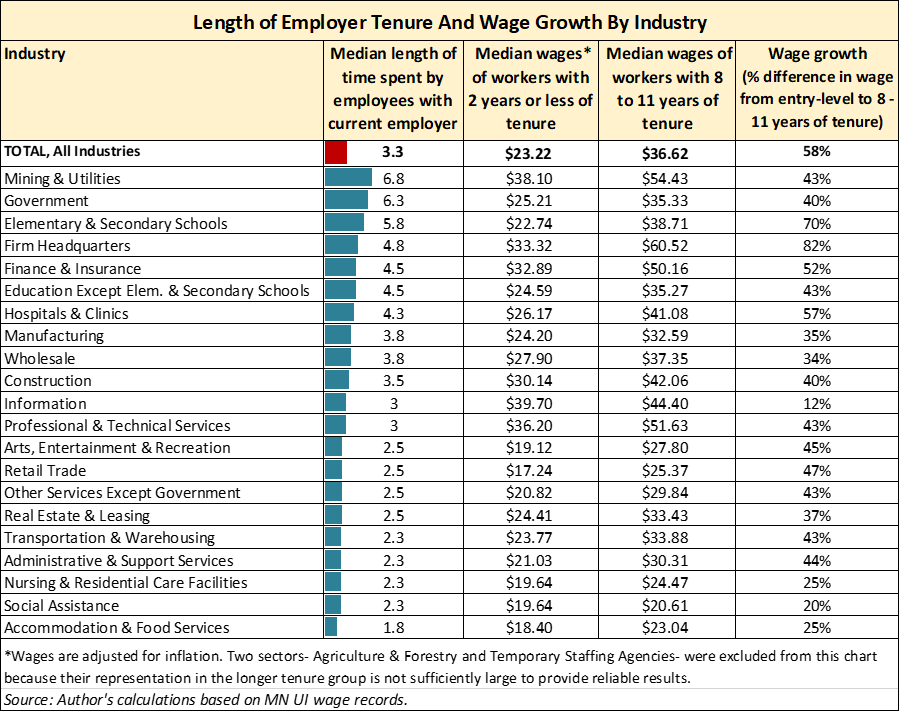
Industries at the very bottom of the chart— Transportation & Warehousing, Administrative & Support Services, Nursing & Residential Care Facilities, Social Assistance, and Accommodation & Food Services— had median tenure lower than 2.5 years. This means that half of their workforce spent less than 2.5 years with the firm and the other half spent more years with the firm. They also had the lowest entry-level wages and/or the lowest wage growth from 2 years (or less) from firm entry until 8 to 11 years of seniority.
These sectors offer predominantly entry-level jobs that are part-time or seasonal and offer very few career ladders. For example, the typical employee in the Social Assistance sector who remained with the same firm for 8 to 11 years saw an increase in wages of only 20%. This sector represents employees who provide critically important services to Minnesotans, such as Services for the Elderly and Persons with Disabilities and Child Day Care Services.
The highest premium from tenure was in Firm Headquarters, with a growth in wages of 82%. This extraordinarily steep premium may stem from the fact that the highly skilled occupations usually predominant in this sector— including management and professional occupations— have more internal career ladders relative to low-skilled occupations, motivating workers to stay with their employer longer12. Internal career ladders usually require investments in on-the-job training and other professional development initiatives.
Overall, tenure with the same firm was highest in sectors with higher entry-level wages or higher earnings growth fueled by tenure. This evidence confirms that income growth potential influences workers' choice to stay or leave.
There are some exceptions to this pattern. The Government sector has the second longest employer tenure despite the relatively low entry wages ($25.21) and lower than average wage growth (40%). This is likely because a relatively large share of public sector employees is eligible for defined-benefit pension plans. This observation points to retirement benefits as another important criteria that factors into the decision to stay with a firm longer.
The case of Manufacturing is also instructive. With entry wages of $24.20 and growth of 35%, this sector offers lower than average financial returns to employer tenure. This result helps explain why employer loyalty in Manufacturing is significantly lower than industry loyalty, as shown in Figure 2. In this industry there is a payoff to switching employer. However, Manufacturing is an attractive industry thanks to the paths it offers to job security and on-the-job training without needing to invest in postsecondary education.
This study sheds light on which sectors of Minnesota's economy offer the highest long-term income potential for workers and examines some of the factors that influence workers' decisions on how much time during their careers to spend in one industry and employer. Here is a summary of key finding:
At a time of severe labor shortages and lower workforce participation rates, retaining current employees is strategically important for competitiveness across industries. Employers who are most able to provide a good place to build a career are best positioned to win the talent race.
1This study partially replicates, with various adaptations, the methodology and research questions addressed by Thompson, Michael and Justis, Rachel: Indiana Employee Tenure by Industry and Manufacturing Sub-Sector, InContext, Indiana Business Research Center, 2010. INcontext: Indiana Employee Tenure by Industry and Manufacturing Sub-Sector
2Consistently with the literature, we measure employer tenure as length of employment with the same firm. Furthermore, the study determined an individual's dominant industry and employer within each year as the industry (and employer within that industry) in which the individual spent the most time and earned the most income. For example, if someone in 2022 spent the most number of quarters and earned the most income from a company in the Manufacturing industry, Manufacturing would be considered his/her dominant industry.
3This measure underestimate real length of tenure for older workers, because the maximum tenure a worker can have in our dataset is 19 years (the first measurement is 2004). Our measures also underestimate tenure for workers who moved to Minnesota from other states, although this risk is minimized by limiting the sample to workers who reside in Minnesota and hold a Minnesota driver's license.
4The median age in these four industries in our dataset was 40 years old.
5Jobs in Temporary Staffing Agencies tend to be of low quality because part-time, temporary contracts are associated with low job security and low access to health care, retirement, vacation leave and other benefits.
6See Smartest Dollar: The Most Unionized Industries in the U.S. [2022 Edition]
7In the Nursing & Residential Care facilities sector, unions are more common in nursing homes with more residents, in hospital-based or chain-affiliated facilities, and in facilities serving a higher proportion of Medicaid patients.
8According to findings from the Minnesota Hiring Difficulties survey, employers attributed a larger share of skills gaps (or recruiting difficulties due to lacking candidates' skills) to inadequate levels of industry experience than to inadequate levels of education. See 2013 report Are skilled workers scarce? Evidence from employer surveys in Minnesota
9Since length of tenure in our dataset is capped at 19 years, the 15-19 tenure category might include workers who spent more than 19 years with the same industry.
10Having 32,694 workers with valid hourly wages, the Food & Beverage Products Manufacturing subsector represents 16% of individuals displayed in Figure 6.
11See findings from the Hiring Difficulties Survey in Manufacturing from 2019 and this more recent report Why Are There Unfilled Jobs Amid High Unemployment?.
12Source: Current Population Survey (CPS).