by Nick Dobbins
February 2014
Monthly analysis is based on unadjusted employment data.
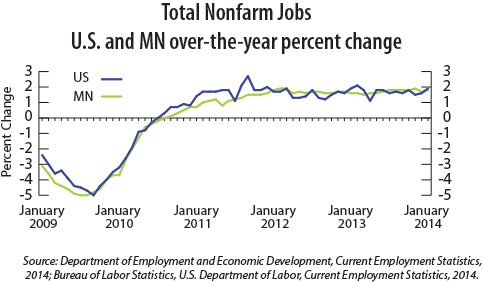
Employment in the Minneapolis-St. Paul-Bloomington MSA fell by 39,201 (2.2 percent) in January and was up by 26,532 (1.5 percent) over the past year. Private employment was off 33,845 (1.6 percent) for the month, and Government employment was down 5,356 (2.2 percent), although both were still up for the year, by 24,580 (1.6 percent) and 1,952 (0.8 percent) respectively. Losses were shared across the board, as both Goods-Producing and Service-Providing employment was down by more than 2 percent, and every supersector showed declines for the month. Among the biggest January job losers were Mining, Logging, and Construction, off 5,148 (8.6 percent) and Professional and Business Services, down 7,902 (2.9 percent). Trade, Transportation, and Utilities fell the farthest, down 10,310 (3.1 percent), with the lion's share of the decline coming from a post-holiday loss of 8,462 jobs in Retail Trade. Over the year, every major industry group was either up or basically flat, save minor declines in Information (off 112, or 0.3 percent) and Financial Activities (558, 0.4 percent). Educational and Health Services has been among the strongest industry groups since 2013, up 10,440 (3.6 percent) in the last 12 months.
Employment dropped 4,823 (3.6 percent) over the month but remains up over the year, adding 1,274 (1.0 percent) since January 2013. As was the case with statewide employment, losses were spread across the economy, with every major industry group either down or flat. Private sector employment was down 3,111 (2.9 percent) with large losses in Trade, Transportation, and Utilities (1,282, 5.1 percent) and Mining, Logging, and Construction (805, 9.6 percent). Government employment shrank at all three levels (Federal, State, and Local) with a total decline of 1,712 or 6.3 percent. Government employment was also slightly down over the year, losing 92 jobs (0.4 percent), but total Private employment was up 1,366 (1.3 percent) led by increases in Leisure and Hospitality (926 jobs or 7.4 percent) and Educational and Health Services (542, 1.8 percent).
Employment was down in January as the metro area lost 1,221 jobs (1.1 percent). Losses were spread fairly evenly, as Information employment, which was basically flat (up 6 or 0.3 percent) was the only major industry group not to lose jobs. Among the biggest job-shedders were Trade, Transportation, and Utilities (down 492 jobs or 2.9 percent), Mining, Logging, and Construction (344 or 10.2 percent), and Professional and Business Services (246 or 4.4 percent). On the year, Rochester employment was up only slightly (364 jobs, 0.3 percent) from January 2013. This small growth was stifled by a slight decline in Manufacturing (down 590 or 5.7 percent) and Educational and Health Services (788 or 1.8 percent).
Employment maintained a similar pattern to the rest of the state and declined sharply, 3,012 (2.9 percent) for the month of January. Private Sector employment was off 2,303 (2.6 percent) with declines on both the Goods-Producing and Service-Providing sides contributing to the decline, with large losses coming from Trade, Transportation, and Utilities following the holiday season. Government employment also declined sharply, losing 709 (4.4 percent) in January. In the last 12 months, employment in the St. Cloud metro has increased 1,744 (1.7 percent), with Private Sector gains of 2,200 (2.6 percent) outweighing a decline in Government employment of 456 (2.9 percent).
Employment fell 1,104 (2.0 percent) in January, settling in at 54,977. Private Sector losses were split between Goods-Producing and Service-Providing industries, with the former losing 221 (2.2 percent) and the latter down 883 (1.9 percent). Government employment was also off slightly, down 57 (0.6 percent) for the month. Since January 2013, employment is up 1,350 (2.5 percent) in the area, with the private sector (up 1,537 jobs or 3.5 percent) overcoming a loss of 187 Government jobs (2.1 percent) for the year.
Employment fell 3,649 (2.7 percent), largely behind January losses in Trade, Transportation, and Utilities, down 1,165 (3.88 percent) thanks primarily to a loss of 964 jobs in Retail Trade. Other industry groups among the biggest job losers were Educational and Health Services, down 646 (3 percent) and Leisure and Hospitality, down 577 (4.4 percent). For the year, employment in the Fargo-Moorhead metro is up 3,278 (2.6 percent), with gains in every supersector save Leisure and Hospitality, which is down 345 (3 percent) since January 2013.
Employment dipped 1,352 (2.4 percent) to a January total of 56,097. Losses were led by a drop in Trade, Transportation, and Utilities employment, down 601 (4.7 percent). Smaller losses were spread throughout the major industry groups, with no supersectors showing monthly gains. In the last 12 months, employment in the metro is up 541 (1 percent) with the only losses in Professional and Business Services (down 198 or 6.8 percent) and Government (down 107, 0.7 percent).
