
Popular or Pragmatic Part 2: The Long View


by Carson Gorecki and Luke Greiner with data and analysis by Alessia Leibert
September 2023
This article is the second of a series assessing postsecondary program and award decisions. The first article and the associated interactive charts compared employment and wage outcomes for graduates of Minnesota postsecondary institutions by award type and instructional program, two and three years post-graduation. For many graduates, it takes multiple years to settle into a career utilizing the skills acquired via postsecondary education. This edition uses similar analysis as its predecessor and takes a longer view at wage outcomes by award and program and incorporates estimates of common costs including student debt. The visualization embedded above can help users to compare wage outcomes 7 years post-graduation for the 2015 cohort. Data on graduate employment outcomes by degree and major used in this article have been created and generously provided by Alessia Leibert.
The previous article in this series showed how three years after graduation, the median hourly wage for earners of sub-baccalaureate certificates was lowest, increasing for earners of associate and bachelor's degrees, and was highest for graduate degree recipients. That order remains in place for annual median wages of the 2015 cohort at seven years post-graduation.
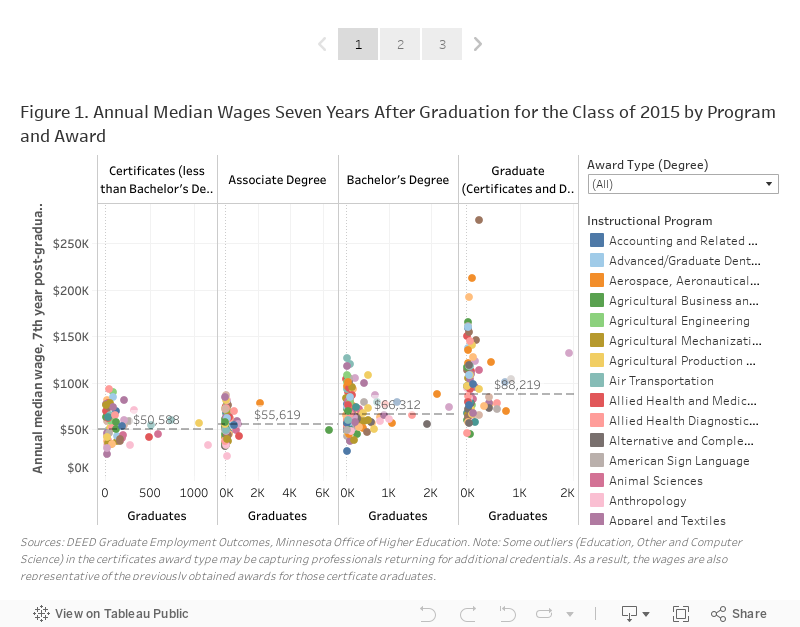
Graduates from certificate programs employed in Minnesota seven years later earned a median annual wage of $50,588. Associate degree holders earned about $5,000 more per year, and earners of bachelor's degrees had an annual median of $66,312. Graduates of graduate programs saw even higher wages at$88,219. The median wage for holders of graduate degrees was 1.74 times greater than the wage of graduates from certificate programs, 1.59 times higher than associate degree holders and 1.33 time higher than earners of bachelor's degrees (see Figure 1).
The highest median wages were for graduates of graduate programs in Medicine ($275,237), Dentistry ($192,225), and Engineering-Related Fields ($192,225). Outside of graduate programs, the next highest median wage was for earners of bachelor’s degrees in Management Sciences and Quantitative Methods ($126,297), Computer Systems Analysis ($120,766), and Building/Construction Finishing, Management, and Inspection ($118,144). The only non-bachelor’s or graduate programs earning more than $100,000 were the certificate programs in Computer Science ($117,842). The range of median annual wages was largest for graduate programs, followed by certificates, bachelor’s, and associate programs.

Note regarding Figure 1: you will find a full color-coded key of all instructional programs covered or in the full, dynamic visualization at the top of the article.
Figure 2 includes some estimates of costs in the graduate wage outcomes calculation. By subtracting the cost of living for a typical family1 ($60,720/year) in Minnesota and adding student debt, we attempt to get a better idea of what net incomes look like for 2015 graduates seven years later. The wage hierarchy remains, but there is a bit more nuance as the cost of education increases by award. According to the Minnesota Office of Higher Education, 65% of 2015 grads had some type of student loan and the average cumulative median debt for all graduates with loans was $23,074.
For recipients of sub-baccalaureate certificates in 2015, the median cumulative debt was $11,318, the lowest of four award types. Associate degree earners finished with about $18,233 and bachelor's degree recipients typically owed just under $27,000. At $53,2502 graduate degree recipients owed the most on average, but the amount differed significantly by the type of advanced degree. For example, master's program graduates with debt owed a cumulative median of $34,522. Doctoral program graduates owed more at $63,237 and the recipients of first professional degrees (veterinary, medical, dental, pharmacy, and legal) owed the most with a median debt of $136,814. The high cost of professional degrees also made students more likely to take out loans: 86% of recipients of first professional degrees had debt upon graduating.
Holding the estimated cost of living constant, we can then see dynamically how a given debt amount impacts an instructional program's net income outcome (Figure 2). The user inputted cumulative debt amount is converted into an estimated annual payment amount3 and subtracted from the annual median wage of graduates. With the average cumulative median debt for all award types at $241 monthly payment and $2,891 annually, no graduate programs and only a handful of bachelor's programs fall into estimated negative net income (below 0 on the Y axis) represented by the red dotted line. However, many more associate and certificate programs – which had lower median debt – saw graduates with median incomes insufficient to cover a conservative estimate of costs, even when the cumulative debt is $0. This includes the certificate program with the largest number of graduates, Cosmetology and Related Personal Grooming Services.
Looking along the X axis of Figures 1 and 2 illustrates how the popularity of specific programs aren't always driven by earning potential. Some programs are very popular with students yet lead to employment that has a high probability of not being able to make ends meet without working multiple jobs.
This begs the question, why are these programs so popular? Are they less academically challenging thus easier to achieve, glamorized in popular culture, or do prospective students fail to understand how their earning potential is largely determined by their major, not how long they attend higher education?
Regardless of the reason why so many students chose programs with low earning potential, the disconnect in some programs between the popularity and the economic demand (via wages) after graduation is a conundrum.

Note regarding Figure 2: you will find a full color-coded key of all instructional programs covered or in the full, dynamic visualization at the top of the article.
Figures 1 and 2 shed light on wage outcomes for graduates at a point in time, seven years post-graduation. But what about the earnings trend? Some programs show significant increases in median income each year post-graduation while others stagnate. Associate degrees in Registered Nursing, Nursing Administration, Nursing Research and Clinical Nursing start relatively high ($67,894 two years postgrad) and increase each subsequent year all the way up to $78,256 in postgrad year seven. Recipients of associate degrees in Teaching Assistants/Aides programs, conversely start relatively low ($21,273) so the 54% increase to $32,827 in year seven still results in a relatively low wage.
Graduates of General Engineering associate programs start low ($17,563) but then see their earnings grow rapidly (+334%) to a median of $76,172 in year seven. The largest rate of increase for associate General Engineering graduates occurred between years three and four. This is likely due in part to the larger than average share of graduates in associate Engineering programs that continue their education, limiting initial earning potential. A similar phenomenon occurs for graduates of graduate Medicine programs. Wages start out relatively low ($64,570 in year two) as most graduates pursue additional specialized training in medical residency programs. However, after three or four years, those graduates finish residency and their true earning potential is unleashed ($275,237 in year seven).

The vast range of earning potential in each award level compounds the importance of carefully considering how to finance higher education. Earning potential is important to consider, but so is the investment of time and money. Ideally these two factors would be considered together so prospective students can make informed decisions about financing their higher education. Figure 2 provides a basis for some "typical" costs associated with attaining higher education, however the loan repayment estimates are created from graduates with a wide range of student debt. Students with very little debt due to scholarships, parent support, or working through college will decrease the "typical" debt amount on one hand, while students without those cost offsets might have substantially higher student loans and monthly payments.
For example, the average annual cost to attend a state university, including tuition, room and board, books and supplies, was $24,825 for the 2021-2022 school year. If students managed to complete their bachelor's degree in just four years, the total cost would amount to just shy of $100,000. This total amount can be decreased through grants and scholarships depending on the income of the student and/or parents. The net price for a two-parent household with a single college student is estimated to be $18,556 per year (in 2019) if both parents work full-time and earn the median wage in Minnesota ($24.25 per hour). For a student in that situation, their total cost would be just over $74,000 if they complete a bachelor's degree in four years. Using current subsidized and unsubsidized federal student loan rates with a 10- year term creates a monthly expense of $806, or $9,666 annually to repay if the full cost is financed.
Although $806 in monthly student loans is not desirable, it's certainly manageable for graduates who complete a degree that provides high earning potential. However, for students who rack up the same level of debt and complete a degree that provides low earning potential, this cost quickly becomes unsustainable. The affordability of higher education depends on both the investment (time and money) and return (probable earning potential). Looking at one or the other in isolation can easily lead to incorrect assumptions of the value of higher education.
Each student's situation is much more nuanced than these simplified visualizations are capable of showing. Individual finances and costs, accumulated debt, chosen program and award, employer, luck, and many other variables will determine whether a chosen educational path was successful for that person. Just as important, income is not the only measure of success, nor is it the only reason students choose to pursue postsecondary education. It is, however, a major consideration and worthy of analysis. By estimating some of the more common expenses, we aim to highlight the costs and benefits of higher education choices in Minnesota.
1Two adults, one working full time and one part time, with one child. We multiplied the family cost by two/thirds to get the primary earner's estimated contribution.
2Weighted average of different graduate degree types
3Based upon the standard repayment schedule of 10 years and a 4.66% interest rate. These terms are based off of the historic terms offered for undergraduate federal student loans in 2015. The interest rate for unsubsidized graduate student loans was a higher 6.21% in 2015.