by Dave Senf
November 2013
Note: All data except for Minnesota’s PMI have been seasonally adjusted. See the feature article in the Minnesota Employment Review, May 2010, for more information on the Minnesota Index.
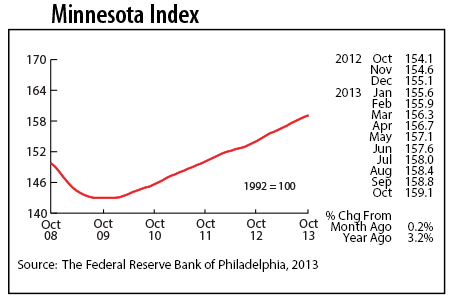
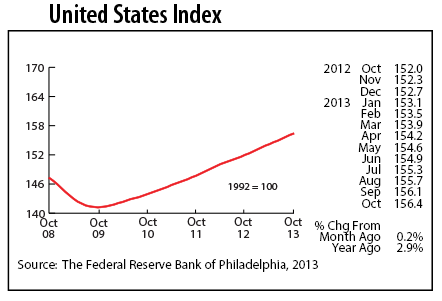
The Minnesota Index advanced for the 47th straight month in October, rising 0.2 percent. All components of the index improved last month with the unemployment rate falling 0.2 percentage points, the largest monthly drop since late 2011. The U.S. index also climbed 0.2 percent last month. After outpacing the U.S. index for most of the year, Minnesota’s index has grown slightly slower than the U.S. index over the last two months.
Minnesota’s index in October was 3.2 percent higher than a year ago while the U.S. index was 2.9 percent higher than 12 months ago. The 3.2 over-the-year reading suggests that Minnesota’s GDP has expanded 3.2 percent over the last 12 months. GDP growth in Minnesota will likely top 3.0 percent for the second straight year. That hasn’t happened in the state since 2003-04.
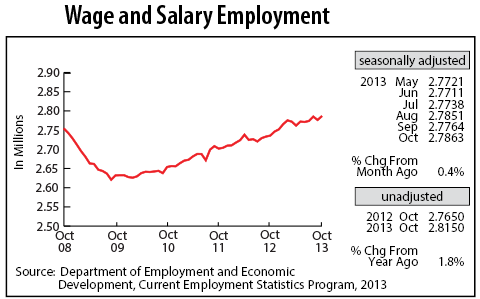
After declining by 8,700 jobs in September, Minnesota’s Wage and Salary Employment rebounded with 9,900 jobs added. Private Sector employment was up 10,300, the biggest monthly gain since February. Goods-producing employment climbed 5,200 jobs, the highest monthly increase since April 2012, while private Service-providing employment increased 5,100. Manufacturing employment soared to its highest monthly increase in 23 years with two-thirds of the hiring occurring in Non-durable Manufacturing. Hiring was robust in Educational and Health Services, Manufacturing, and Construction. Job losses were highest in Other Services, Professional and Business Services, and Government.
Over-the-year job growth using unadjusted employment numbers rose in October to 1.8 percent from September’s 1.4 percent. The U.S. rate was 1.7 percent in both September and October. Minnesota’s annual average job growth rate is likely to be 1.8 percent, a healthy increase from last year’s 1.4 percent. Annual average job growth for the U.S. appears headed for 1.7 percent. Minnesota’s job growth will have surpassed national growth for five of the last six years if current job growth trends continue for the rest of the year.
After trending up over the previous two months, Minnesota’s adjusted online Help-Wanted Ads plunged 6. 9 percent in October, the steepest decline since January 2009. Minnesota’s online help-wanted ad level has been below last year’s level for seven straight months. Slumping help-wanted ad volume suggests that labor demand has dipped compared to last year, but job growth has been significantly stronger over the last few months compared to the same time last year. The help-wanted online decline is also inconsistent with the recently release Job Vacancy Survey, which reported job vacancies up 17 percent in the second quarter of 2013 compared to 2012.
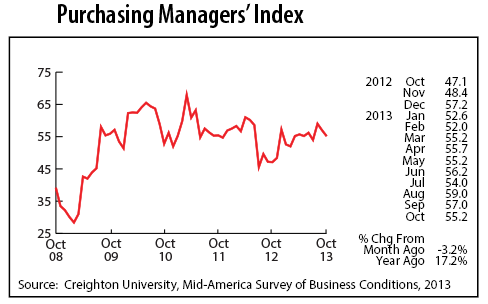
Minnesota’s Purchasing Managers’ Index (PMI) tailed off for the second month in a row, but October’s 55.2 reading remains safely above the 50 growth neutral level. The 55.2 reading signals that Minnesota’s manufacturing sector will continue to expand through the end of the year. The employment component of the PMI was above 50 for 12 straight months, implying that manufacturing employment will also continue to expand during the next few months.
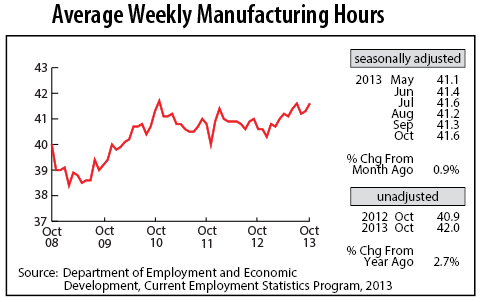
Adjusted Manufacturing Hours spiked to 41.6 hours in October, matching July’s hours for the longest factory workweek since November 2010. The longer manufacturing workweek is consistent with the recent uptick in manufacturing hiring.
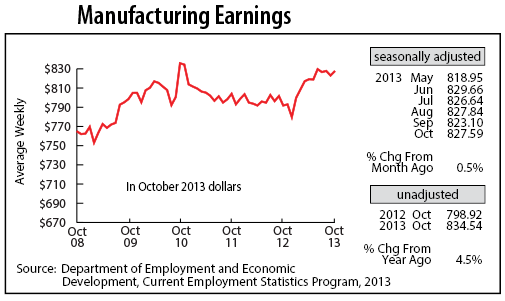
Manufacturing Earnings also rose in October to $827.59. Real factory paychecks have exceeded last year’s levels for the last nine months, indicating that workers are seeing real income gains. October’s paycheck was 4.5 percent higher than a year ago after adjusting for inflation.

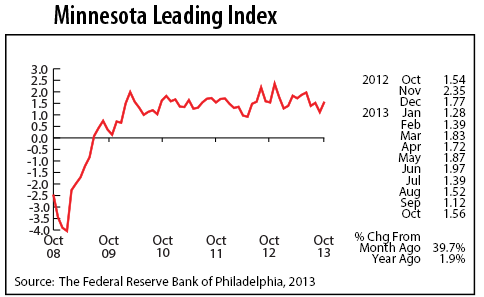
The Minnesota Leading Index has cooled off some from the first half of the year, but October’s 1.6 reading implies that the state economy will expand by roughly 1.6 percent over the next six months. That translates into a solid 3.2 percent annual real GDP growth rate. Minnesota’s job growth will continue to run around 1.6-1.8 percent if the state economy continues to expand by more than 3 percent.
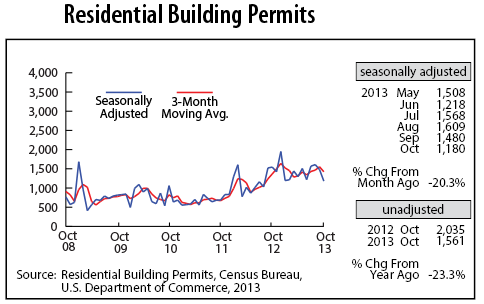
Adjusted Residential Building Permits downshifted for the second straight month, tumbling 20.3 percent in October. Minnesota’s housing market continues to bounce back, but the rebound remains uneven. Permit levels are down from a year ago over the last two months.
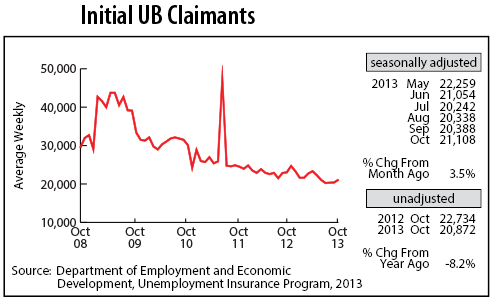
Adjusted Initial Claims for Unemployment Benefits (UB) climbed for the third consecutive month in October, rising 3.5 percent. The number of Minnesotans filing new claims for unemployment, however, remains low, suggesting that the state’s labor market continues to be solid.