by Dave Senf
September 2019
Note: All data except for Minnesota's PMI have been seasonally adjusted. See the feature article in the Minnesota Employment Review, May 2010, for more information on the Minnesota Index.
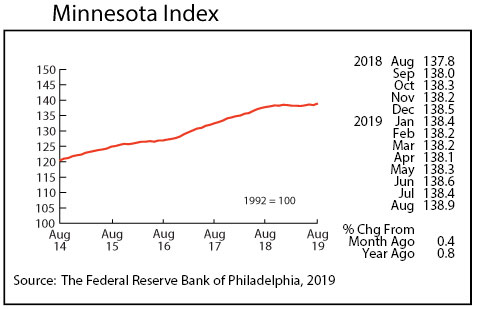
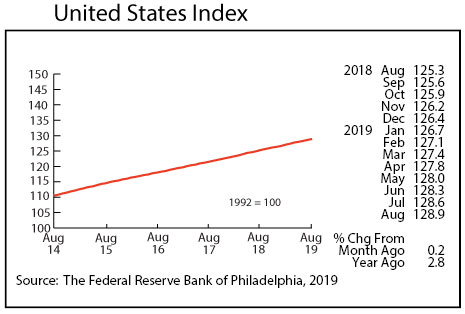
The Minnesota Index jumped to an all-time high of 138.9 in August, climbing by 0.4 percent. The index's climb was supported by an increase in wage and salary employment and a drop in the state's unemployment rate. The U.S. index increased by 0.2 percent.
The August reading was 0.8 percent higher than a year ago compared to the U.S. annual gain of 2.8 percent. Minnesota's economic growth over the last 12 months has been significantly slower than U.S. growth.
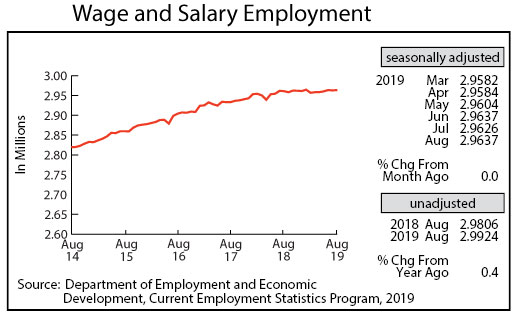
Adjusted Wage and Salary Employment bounced back in August as 1,100 jobs were added, the same number of jobs that were cut in July. Minnesota's seasonally adjusted wage and salary employment is up only 2,600 through August. Minnesota added 18,100 jobs over the same period in 2018. Job growth in the state has nearly stalled out even though jobs have increased in six of the eight months so far this year. Job estimates from October 2018 to September 2019 will be benchmarked in March next year. The revised job numbers are expected to show slightly higher job growth but annual job growth will be down for the fourth straight year.
The private sector accounted for all 1,100 jobs as public sector jobs were unchanged from last month. All of the job growth was in service providing industries as goods producing employment retreated for the first time in six months. Minnesota manufacturers cut payroll totals in August after adding to their payrolls over the previous two months. Leisure and Hospitality along with Financial Activities added the most workers while Educational and Health Services and Professional and Business Services cut the most workers.
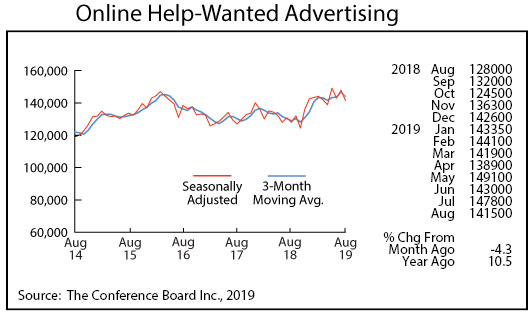
Online Help-Wanted Ads zigzagged down in August to 141,500, a 4.3 percent drop-off. Job postings nationally tailed off 1.5 percent in August which pushed Minnesota's share of nationwide online help-wanted ads down a notch to 2.7 percent compared to the state's 2.0 percent of U.S. wage and salary employment. Labor demand continues to remain robust in Minnesota based on online job postings.
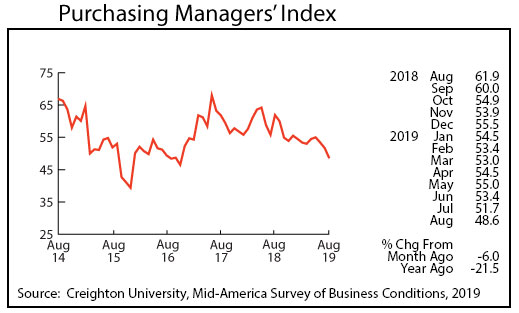
Minnesota's Purchasing Managers' Index (PMI) dipped for the third consecutive month to 48.6, the first sub-50 reading in almost three years. The other two comparable indices fell below 50 in August with the Mid-America Business Index slipping to 49.3 and the Institute of Supply Management's national PMI sliding to 49.1. Manufacturing activity has been slowing across the U.S. and Minnesota for almost a year now as tariffs wars with trade partners and slowing global economic growth take a toll on manufacturers.
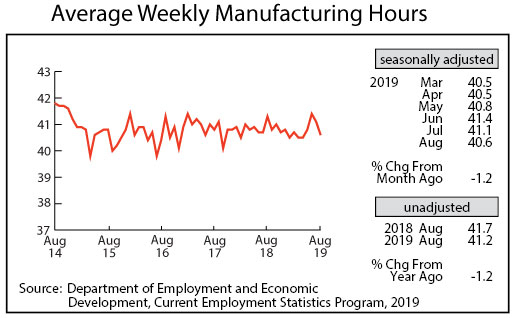
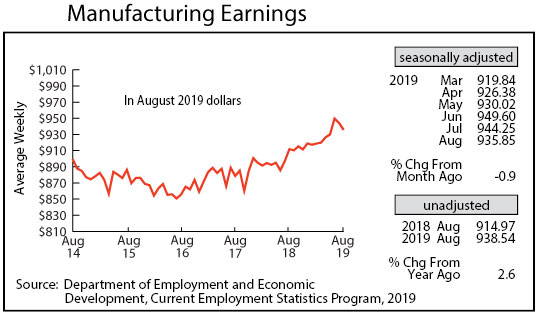
Adjusted average weekly Manufacturing Hours slipped sharply for the second month in a row to 40.6 hours in August. That is the shortest factory workweek since April and is consistent with the sliding PMI index. After setting a record-high paycheck in June, average weekly Manufacturing Earnings, adjusted for inflation and seasonality, have fallen for the second straight month in August to $935.85. Real manufacturing earnings, adjusted for inflation but not seasonality, were up 2.6 percent from a year ago. Since last August real factory paycheck have averaged 3.9 percent monthly gains.
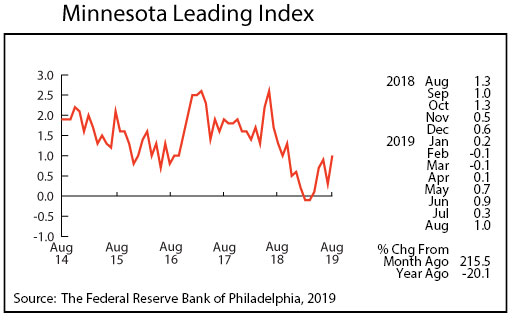
The Minnesota Leading Index spiked up to 1.0 in August, its highest level in 12 months. The 37-year monthly average is 1.4, so the 1.0 reading suggests that Minnesota's economic growth through the rest of the year will be slightly below the historical rate. The state's reading ranked 30th, right below South Dakota and slightly ahead of Nebraska. The U.S. leading index was 1.4 percent, indicating that over the next six months Minnesota's economic growth will continue to lag the national pace.
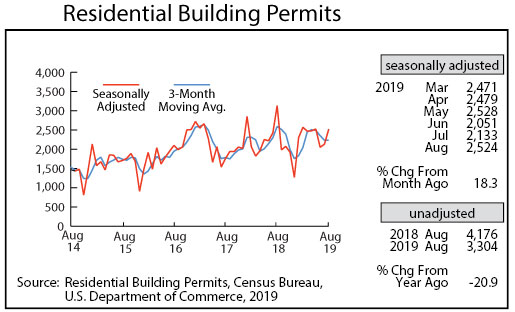
Residential Building Permits rose for the second month in August, this time to 2,524. Minnesota home building permits accounted for 2.6 percent of all U.S. home building permits issued in August which is slightly higher than the state's 1.9 percent population share. The level of home-building permits has been strong throughout the year, indicating that home building activity in the state is running significantly ahead of the 2018 pace.
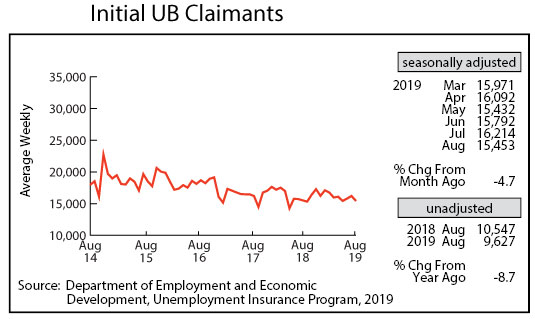
Seasonally Adjusted Initial Claims for Unemployment Benefits (UB) tailed off in August after having inched up the previous two months. The 15,453 initial claims in August were the second lowest monthly level this year, just a tad higher than May's 15,432. The initial claims level remains extremely low by historical standards, indicating that Minnesota's slow job growth is likely more related to an extremely tight labor market than to any drop in demand for workers.