
by Dave Senf
March 2024
Like any economy, Minnesota's economy is continuously changing both in the short run and over the long run. Tracking industrial employment trends is essential to understanding how the state's economy has evolved and for gaining some sense of where it is headed. Recording and analyzing employment by industry might seem like a straightforward task, but the evolving nature of the economy creates industrial classification system hurdles. There is a trade-off between consistency through time and the need to update the classification system periodically to accurately account for new economic activity.
Up until 1997, the Standard Industrial Classification (SIC) system guided industrial employment reporting. Establishments were assigned to industries based on a mix of criteria including production process, products produced and consumers of the products. The SIC was updated a number of times over the years until being completely replaced in 1997 by the North American Industry Classification System (NAICS), which classifies establishments into industries based solely on the activities performed at the establishment and not on the customers served. The NAICS hierarchy, which is updated every five years, was designed to be flexible, allowing for revisions to reflect changes and innovations in the economy as quickly as possible. The most recent update is ongoing, as NAICS 2022 is currently replacing NAICS 2017.
The shift from SIC to NAICS led to significant reclassification of employment from Manufacturing, Wholesale Trade and Retail Trade to other sectors, particularly to service sectors. For example, under the SIC system, employment at restaurants and bars were included in Retail Trade, not Accommodation & Food Services as in NAICS. The change moved roughly 157,000 jobs from Retail to Service.
Likewise, Minnesota's 1999 manufacturing employment was 440,000 jobs under SIC, but dropped to 397,000 jobs under NAICS, with most of the difference in employment transferred to a new NAICS sector: Management of Companies & Enterprises.
As noted, unlike SIC, under NAICS establishments are assigned into industries based on the activities performed at the establishment, rather than as a function of the products they sell or the customers they serve. Rather than being included as manufacturing employment as was the case in SIC, corporate headquarters employment at a major manufacturing company are recorded in the Management of Companies & Enterprises sector in NAICS. Corporate headquarters employment at large banks, retail companies, health insurance firms and global food corporations are also tabulated in the Management of Companies & Enterprises sector.
The SIC to NAICS classification transformation is why detailed industrial employment analyses over long time periods are hard to find. DEED's two major employment series – Quarterly Census of Employment & Wages (QCEW) and Current Employment Statistics (CES) – provide consistent NAICS industry numbers back only to 2000 and 1990, respectively. CES employment estimates back to 1990 required challenging tracking of each NAICS classified establishment in 1999 back to 1990. Anyone examining long-term changes in Minnesota wages, employment, unemployment, GDP, or value-added by industry through history needs to be aware of these industrial classification changes. While the general trends, especially at the higher aggregated sector level, provide useful information, the magnitude of the trends are likely moderately distorted by the SIC to NAICS conversion.
Figure 1 displays Minnesota wage and salary employment classified across seven highly aggregated divisions (the top level of aggregation in SIC) from 1950 to 2023. To account for the changing classification problem, CES employment data based in the SIC from 1950 to 2022 was used. NAICS-based employment data (at the supers-sector level) from 1990 to 2023 was converted to SIC-based employment at the division level using BLS provided national conversion ratios.2 The end result is that all employment numbers in Figure 1 are SIC based, albeit at a highly aggregated level.
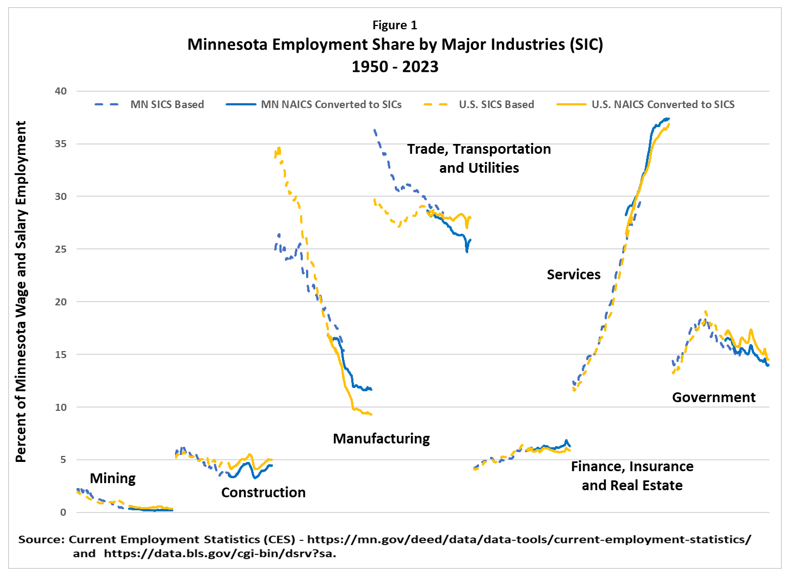
In the early 1950s, Minnesota's wage and salary employment was concentrated in the Trade, Transportation & Utilities division (37% of all employment) and Manufacturing (25% of all employment). Minnesota's employment was a lot less diverse in the 50s and 60s and more dependent on agriculture as compared to today. Production-related agriculture isn't accounted for in the wage and salary employment used here, as most agriculture employment was self-employment (individual farmers) 70 years ago.
Trade, Transportation & Utilities employment accounted for a larger share of employment in the state from 1950 to 2002, owing to disproportionally higher railroad employment, farm-related wholesale trade and airline employment compared to nationally. However, the state has a slightly smaller share of employment working in Trade, Transportation & Utilities than the U.S. today.
Minnesota was less dependent on Manufacturing than the U.S. up until the late 1970s, when the state's Manufacturing base was boosted by growth in mainframe computer production. Currently, Manufacturing employment accounts for roughly 11% of the state's payroll jobs, compared to 9% nationally (when using SIC-based numbers). Manufacturing employment peaked in the state around 2000, at roughly 428,000 jobs, but since then has declined to roughly 346,000 jobs in 2023.
The 20% decline in Minnesota manufacturing jobs since 2000 have been lost to increased productivity and automation, shifts in consumer demands and globalization, as other countries like Mexico and China developed over the last three decades, as well as to other states. In addition, some outsourcing of tasks previously performed by workers in-house and counted as Manufacturing employment are now done through contracts with outside providers. Janitorial, security and payroll processing are examples of services now provided by outside partners. The use of temporary help workers has also increased at Manufacturing firms, thus shrinking Manufacturing employment but increasing employment in the temporary help industry.
Mining employment has slipped from 2% of all payroll jobs seven decades ago to 0.2% in 2023, as iron ore mining jobs peaked in the mid-1970s at 14,000 jobs and have since declined to roughly 4,000 over the last few years. The Mining industry in Minnesota during the 1950s accounted for a slightly higher percent of employment than nationally, but now is slightly under the national share.
Construction employment has, for the most part, increased at the same rate as overall employment expansion, accounting for 4% of Minnesota's wage and salary employment in 1950 and 5% in 2023. Construction employment as a share of total employment has been slightly lower than the U.S. share since the 1970s.
Finance, Insurance & Real Estate payrolls have increased faster than overall employment in both Minnesota and nationally over the last 70 years. Minnesota has also had roughly the same share of total employment in this division as nationally, although Minnesota's share moved slightly ahead of the U.S. share over the last 20 years.
Public sector, or federal, state and local government, jobs accounted for a slightly higher percent of total employment in 1950 (14.8%) than in 2023 (14.3%). The public sector's share of employment in the state peaked at 19% around 1975-76. Those peak years were the peak years of the Baby Boom generation swelling public school enrollment. Minnesota's public sector employment represented a larger share of total employment than nationally during the 50s and 60s, but since then has had a slightly lower share than the U.S. share.
The well-known shift to service jobs over the last 70 years is hard to miss, with Figure 1 showing the share of total employment accounted for by service employment shooting up sharply year after year. Of the 2.1 million payroll jobs added over the last seven decades in Minnesota, 47% have been service jobs. Staggering expansions in service industries (using NAICS industry titles) such as Hospitals, Individual & Family Services, Office of Physicians, Computer Systems Design & Related Services and Management, Scientific & Technical Consulting Services have occurred over the last seven decades. Service jobs accounted for 13% of Minnesota's payroll employment in 1950, but increased to 37% by 2023.
The switch to NAICS 25 years ago makes the comparison of shifting employment between detailed industries tricky over long time periods. However, work has been done on converting SIC to NAICS at a detailed level back to 1990, thereby providing 30-plus years of reliable detailed industry-level employment data. Figures 2A and 2B break up Minnesota's employment since 1990 into 24 NAICS sectors and industries as opposed to the much more aggregated seven SIC divisions shown in Figure 1.
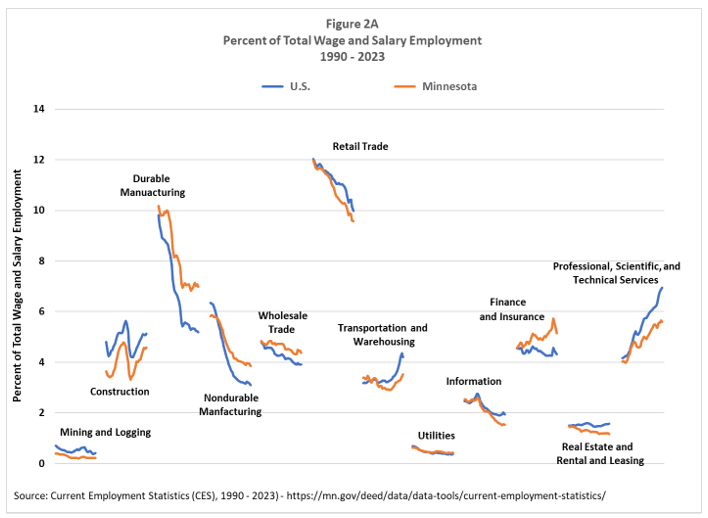
The highest employing sectors in 1990 were Retail Trade (12.0% of total employment), Local Government (10.8%), Durable Manufacturing (10.2%) and Health Care (8.7%). Eleven sectors have increased their share of the state's job count since 1990, meaning employment in these sectors grew faster than total employment across all sectors. The other 13 sectors had job growth below the total job growth and saw their share of employment tail off. Health Care (+4.4 percentage increase), Social Assistance (+1.8), Professional, Scientific & Technical Services (+1.9) and Construction (+0.9) boosted their share of total employment the most.
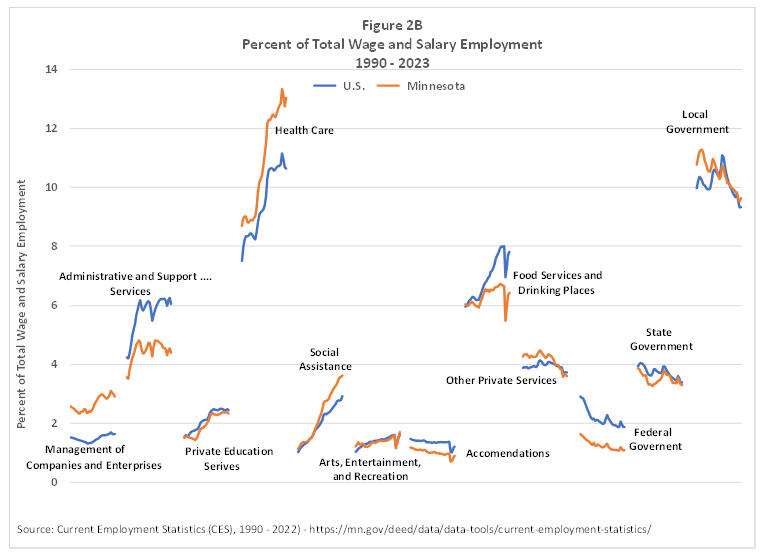
The 33 years of shifting industrial employment moved Health Care up to the sector with the most employment (13%), followed by Local Government (9.6%), Retail Trade (9.6%), Durable Manufacturing (7.0%) and Food & Drinking Places (6.4%). Interestingly, the sectors with the smallest share of employment in both time periods were the Mining & Logging sector (0.4% in 1990 and 0.2% in 2023) followed by utilities (0.6 % to 0.4%).
Wage and salary employment totaled slightly below three million jobs in 2023, so a percentage share of employment represents approximately 30,000 jobs. The 13% share accounted for by the Health Care sector in 2023 converts to roughly 390,000 jobs, while the 0.2% share of Mining & Logging represents about 6,000 jobs.
Figures 2A and 2B not only display how Minnesota's industrial employment mix has changed over the last three decades, but also compares the state's mix to the national mix. Minnesota's employment mix has grown less similar to the U.S. mix over the last 33 years. For example, the state had approximately the same share of jobs in Durable Goods Manufacturing as the U.S. in 1990. But Durable Goods Manufacturing employment in Minnesota has outperformed U.S. Durable Goods Manufacturing employment (both Minnesota and the U.S. lost Durable Goods Manufacturing employment, but Minnesota has lost less percentage wise). The opposite has occurred for Professional, Scientific & Technical Services employment. Minnesota's share of total employment in this high-paid sector has grown rapidly, but still lagged the increase nationwide.
Six sectors in Minnesota have seen their share of total employment increase relative to the U.S. and six sectors have seen their share of total employment decrease relative to the U.S. Minnesota's share of total employment in the other 12 sectors have stayed about the same relative to those sectors' U.S. shares.
| Minnesota Sector Shares Compared to the U.S. | |
|---|---|
| Sectors with Increasing Shares | Sectors with Decreasing Shares |
| Durable Goods Manufacturing | Transportation & Warehousing |
| Nondurable Goods Manufacturing | Information |
| Finance & Insurance | Professional, Scientific & Technical Services |
| Management of Companies & Enterprises | Real Estate |
| Health Care | Administration & Support Services |
| Social Assistance | Food Services & Drinking Places |
The employment mix is the key factor in state or metropolitan statistics area relative wages and salaries and household income differentiation, when all else (such as labor force participation) is the same. A higher percent of jobs in higher-paid sectors including Finance & Insurance, Management of Companies & Enterprises, or Professional, Scientific & Technical Services and Mining & Logging boost state or metro income compared to having a higher percent of jobs in lower-paid sectors such as Food Services & Drinking Places, Accommodations and Retail Trade.
Changes to Minnesota's industrial employment mix over the last three decades have been a mixed bag relative to U.S. changes when it comes to wages, salaries and household income. Increasing shares relative to the U.S. in Minnesota's Finance & Insurance, Management of Companies & Enterprises and Health Care sectors help to boost total wages, salaries and household income. But decreasing shares relative to the U.S. in Professional, Scientific & Technical Services and Information bring down total wages, salaries and household income. Since 1990, Minnesota real median household income has outperformed the U.S., with Minnesota rising from $64,630 in 1990 to $90,390 in 2022, the latest year data is available. The U.S. real median household income was $61,500 and it was $74,500 in 2022.
Completing a three-year recovery from the pandemic-related employment plunge, private wage and salary employment in Minnesota surpassed its pre-pandemic peak during the first quarter of 2023.3 See Figure 3). While overall employment is up slightly from the pre-pandemic level, the recovery has varied across industries. Some industries are still below 2019 payroll numbers, while other industries have payroll numbers above pre-pandemic totals. Are the changes a continuation, an acceleration, or reversal of from pre-pandemic trends? In other words, did the pandemic permanently alter the state's industrial mix in some substantial way impacting the state's future industrial mix?
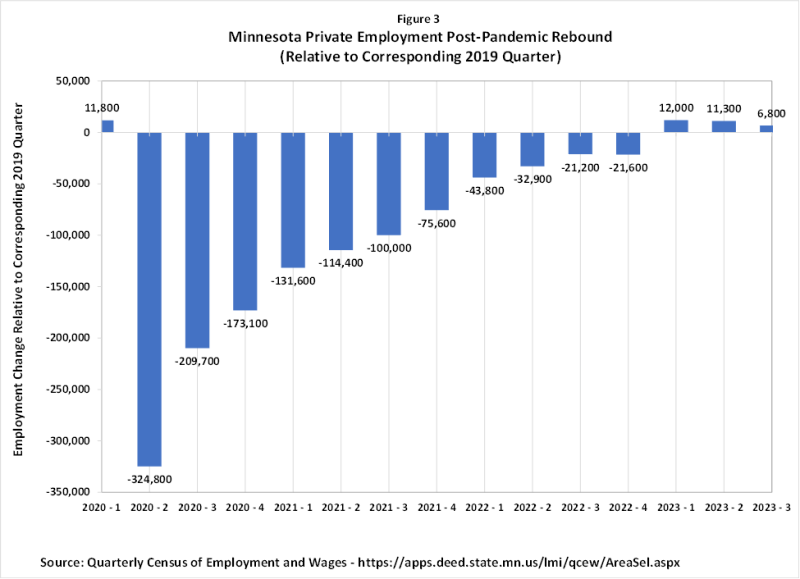
Table 1 displays workforce changes under the highly aggregated sectoral level, comparing employment in the third quarters of 2019 and 2023. Information and Financial Activities employment had the largest employment decline in percentage terms, while Finance & Insurance had the largest absolute drop, followed by Retail Trade. Utilities and Construction had the highest percentage increase, while Health Care & Social Assistance and Construction led in absolute workers added, with Construction second in adding to payroll numbers.
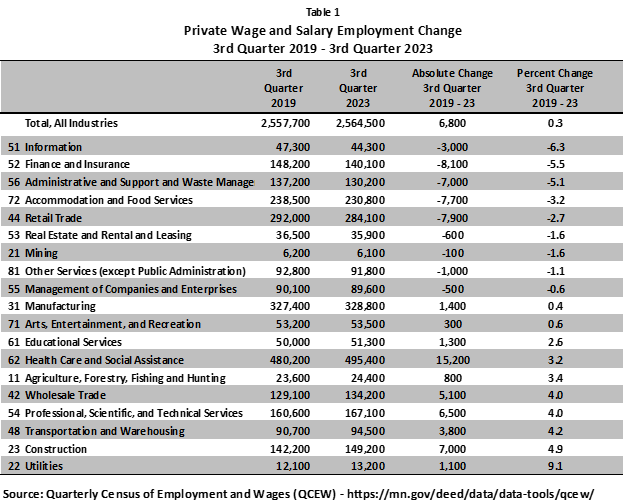
Customer-facing sectors such as Accommodation & Food Services and Other Services, which include businesses such as Hotels, Restaurants, Amusement Parks, Barber Shops and Beauty Salons, suffered the largest employment declines during the pandemic. Employment in these sectors remains below pre-pandemic levels, but job growth was strong in 2023 and is expected to continue to be solid over the next few years.
While the pandemic had a drastic short-term impact on customer-facing sectors, a minimal impact is likely over the long-term as Minnesota's economy continues to expand, providing households with higher income that in turns boosts household spending across customer-facing business. In many cases, customer-facing businesses have also altered their customer interactions. Low unemployment and slow labor force growth will probably have more of an effect on workforce growth in Accommodation & Food Services and Other Services than any permanent change arising out of the pandemic.
The current employment deficits in Information and Finance & Insurance are related more to long-term trends than any lingering pandemic-related trends. In the Finance & Insurance sector, the pressure to cut costs in response to falling loan demand and increased uncertainty brought on by higher interest rates has driven credit institutions, especially mortgage-providing businesses, to reduce staff over the last two years. Employment in Finance & Insurance peaked in 2020, decreased slightly in 2021, then recorded even more significant cuts in 2022 and 2023 as interest rates rose. Partial recovery is expected as interest rates ease but automation and changing consumer preferences will keep this sector's workforce below its 2020 peak over at least the short-term.
The employment deficit in Administrative Support & Waste Management Services is part cyclical and part pandemic related. The cyclical part is falling temporary work employment over the last year. The pandemic-related gap is related to lower demand for business services, as many workers continue working from home. The battle over returning to the office is still being waged, thus the permanence of these pandemic effects remains undecided.
The shortfall in Retail Trade employment is concentrated at Motor Vehicle & Parts Dealers, Clothing & Clothing Accessories Stores, Electronics & Appliances Stores, Food & Beverage Stores and Miscellaneous Store Retailers. The last three retail industries listed above were expected to see declining employment over the long run due to changing consumer habits and automation, so their contribution to the Retail Trade decline is probably less related to the pandemic than other Retail Trade industries that are still short employment-wise from pre-pandemic levels.
Motor Vehicle Dealer employment is down from 2019 as automobile sales continue to run below 2019. Some of the sales slippage can be traced to supply chain issues which rose directly out of the pandemic. Auto sales are likely to return to 2019 levels in the near future now that supply chain problems have been resolved, lifting Motor Vehicle & Parts Dealer employment. Some of the employment drop in Clothing & Clothing Accessories Stores is likely to have been pandemic driven by accelerating the move to online shopping. Food & Beverage Stores employment initially rose during the pandemic but has since declined.
Transportation & Warehousing employment expanded rapidly since 2019, related in part to the growth of online shopping, which was probably boosted by the pandemic but also was anticipated over the long run. Manufacturing employment rebounded from the pandemic faster than most sectors, before tailing off in 2023. The reshoring of Manufacturing movement, or the push to return production to the U.S., spurred by supply chain problems during the pandemic, may reverse the long-term trend of declining Manufacturing employment related to the exporting of jobs to other countries, but continuing productivity advances across U.S. manufacturers likely curb significant Manufacturing job growth.
Wholesale Trade jobs have grown more than projected over the last few years. Some of the solid growth may be related to an increase in online shopping. Modest employment growth is expected over the long-run, given the trend toward expansion following the huge job increase experienced from 2021 to 2022, when this sector returned to growth during the early part of pandemic recovery.
Construction, Health Care & Social Assistance and Professional, Scientific & Technical Services employment have moved well beyond pre-pandemic levels. The strong growth in these sectors isn't surprising, as these sectors are projected to add a majority of jobs projected over the long-term in Minnesota.
Construction employment is way ahead of projected employment, but this sector's hiring is more cyclical than most sectors. Part of the increase in Construction employment is related to increased demand for remodeling arising during the pandemic and also by higher state and local government infrastructure spending, in part through federal aid.
Minnesota employment experienced a wide swing over the last three years due to the pandemic and its wide-ranging impacts on consumer habits, company policies and other societal changes. Some Minnesota sectors have more than recovered from the pandemic, while other sectors are still below pre-pandemic levels. Changes in consumer demand and in production and business processes brought on by the pandemic have impacted some sectors more than others and have marginally shifted the state's industry mix.
However, most of the pandemic-induced employment shifts will fade over time. Long-term trends in the state's industry mix will mostly be determined by a wide array of factors unrelated to the pandemic. Although job growth is projected to be slower in the future than in the past, due primarily to the speed limit of a slower growing labor force, the shift to service industries is expected to continue unabated with 80% of job growth expected to occur in service-providing industries. The fastest job growth in Minnesota will likely be generated in the Health Care & Social Assistance, Professional, Scientific & Technical Services and Transportation & Warehousing sectors.4
1CES data produced under the discontinued Standard Industrial Classification (SIC) system SIC-based estimates are available through December 2002, and can be downloaded using the BLS Create Customized Tables download tool
2NAICS based 1990 – 2023 data is available on the BLS website. Information on the conversion ratios is also available on the BLS NACIS website.
3Quarterly Census of Employment and Wages (QCEW) data is used here with each quarters private employment compared to corresponding quarters in 2019, the year before the pandemic developed. Since QCEW employment data is not seasonally adjusted more reliable comparison over time is achieved by comparing the corresponding quarters. In Figure 1, first quarter employment for all years is compared to first quarter 2019 employment, second quarter employment for all years are compared to second quarter 2019 employment and so forth.
42022 – 2032 employment projections for Minnesota will be published in the summer of 2024. 2020 – 2030 employment projections. U.S. 2022 – 2032 employment projections.