by Dave Senf
December 2016
Note: All data except for Minnesota’s PMI have been seasonally adjusted. See the feature article in the Minnesota Employment Review, May 2010, for more information on the Minnesota Index.
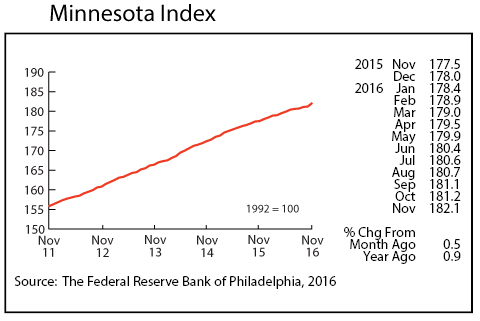
The Minnesota Index surged in November, signaling that Minnesota’s economy has picked up some speed after four months of lackluster growth. The 0.5 percent spike in the index, the largest since May 2014, was fueled by increases in all four components of the index. Wage and salary employment rebounded from a steep drop in October, the state’s unemployment rate declined for the first time since March 2015, average weekly manufacturing climbed, and inflation-adjusted wage and salary distributions rose.
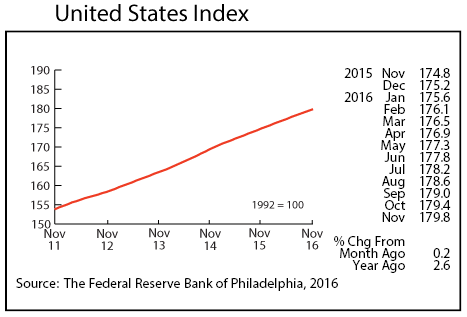
The U.S. Index climbed 0.2 percent for the 12th month in a row in November. Minnesota’s monthly gauge of economic growth hasn’t outpaced the national rate by this wide a margin since September 2011. Minnesota’s index was up 2.6 percent from a year ago while the U.S. index was up 2.9 percent from 12 months ago.
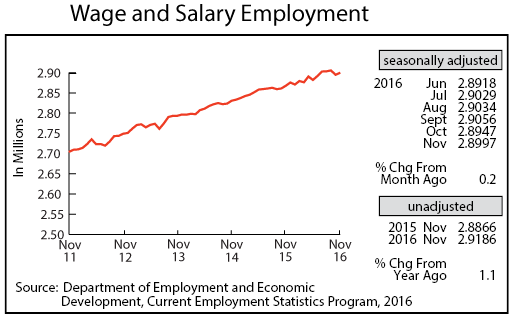
Minnesota’s adjusted Wage and Salary Employment, after dropping by 10,900 jobs in October, partially rebounded in November, adding 5,000 jobs. Private sector employment climbed 5,800 positions while government payrolls declined by 800 jobs. More jobs were added on the goods-producing side than on the service providing side as Construction payrolls jump by 3,400 workers. November’s unseasonably warm weather looks to have extended construction work this year. The Educational and Health Services, Leisure and Hospitality, and Financial Activates sectors also picked up their hiring pace. Job loss was concentrated in the Professional and Business Services sector.
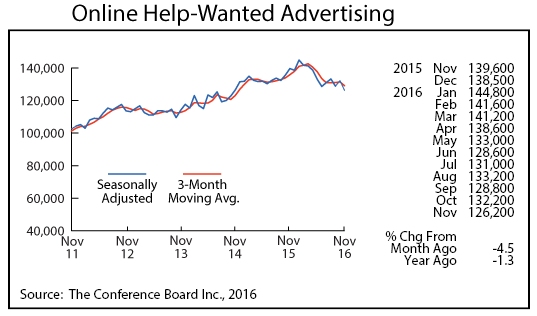
Online Help-Wanted Ads reversed directions in November, falling to 126,200, the lowest level since September 2014. Minnesota’s 4.6 decline in November was steeper than the 2.4 drop nationally, but the state still records a disproportionately high share of national online job adverting. Minnesota accounted for 2.0 percent of national wage and salary employment in November while accounting for 2.7 percent of U.S. online help-wanted ads.
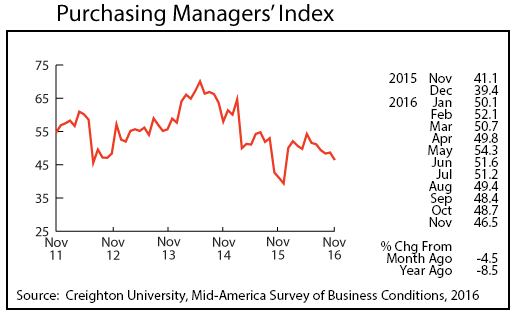
Minnesota’s Purchasing Managers’ Index (PMI) continues to signal that Minnesota’s manufacturing sector is struggling to gain any momentum. Minnesota’s PMI dropped to 46.5 in November, its lowest level since last December. Manufacturing employment in the state is down 0.4 percent over the last 12 months, reflecting the manufacturing pullback. The Mid-American Business Conditions Index, a leading economic indicator for nine states including Minnesota, climbed to 46.5 while the corresponding national index rose to 53.2.
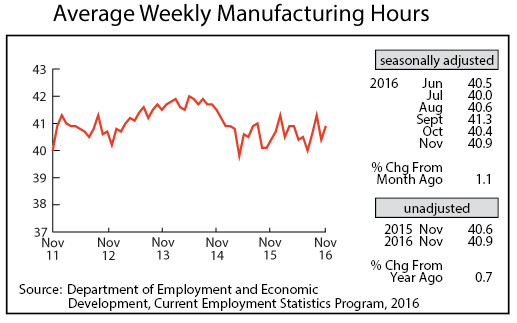
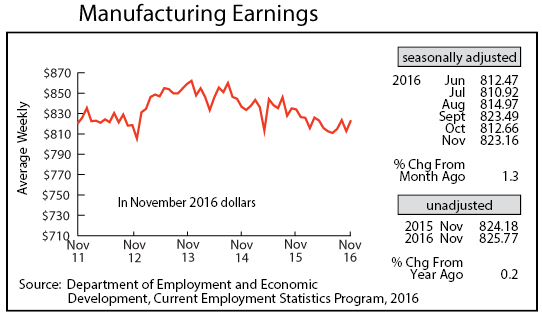
Adjusted Manufacturing Hours regained some lost ground in November, ticking up to 40.9 hours. The factory workweek has been shrinking over the last two years, however, after a record high in 2014. Average weekly Manufacturing Earnings also rose in November climbing to $823.16, but factory paychecks have followed the same downward drift as manufacturing hours over the last few years. The highest average annual manufacturing paycheck was in 2013 at an inflation-adjusted $849.37. The average for 2016 will be roughly 4 percent below that level.
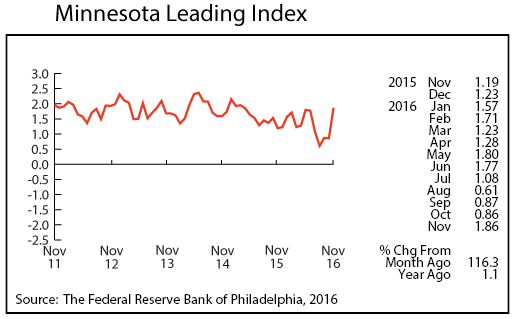
The Minnesota Leading Index rocketed up in November, increasing from .86 in October to 1.86. November’s huge jump, if it holds, is encouraging as it signals state GDP growth over the next six month will be twice as fast as predicted just in October. Several more months of strong leading index values are needed before taking November’s spike seriously.
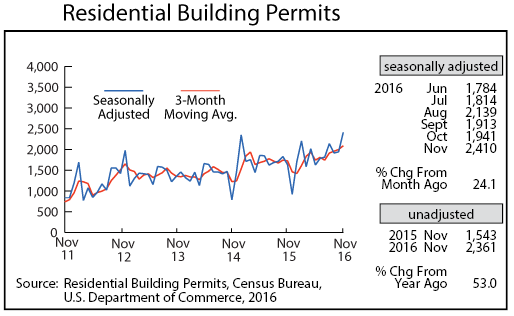
Adjusted Residential Building Permits also surged in November, spiking to 2,410. That was the highest monthly number since June 2006 and only the fourth month where building permits topped 2,000 since 2006. Over half of the permits were for apartment building, however. Single-family home building permits remain below average historical levels.
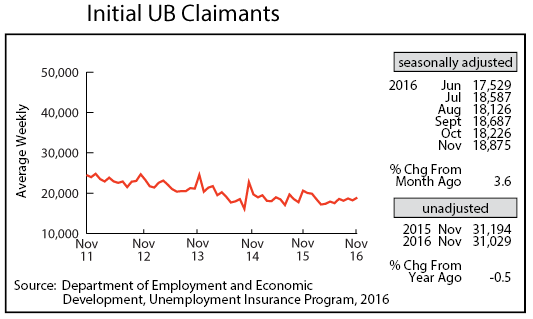
Adjusted Initial Claims for Unemployment Benefits (UB) zigzagged up in November to 18,875 but remain down 5.0 percent from last November. Initial claims over the last six months, however, have gradually increased, suggesting that Minnesota’s slower-than-national job growth may not be totally blamed on a tighter labor market.
