by Dave Senf
May 2020
Note: All data except for Minnesota’s PMI have been seasonally adjusted. See feature article in the Minnesota Employment Review, May 2010, for more information.
The Philadelphia Federal Reserve Bank, which produces the Minnesota Leading Index, has temporary suspended generation of state leading indices since the indices are based on data from the time period largely unaffected by the COVID-19 outbreak. The standard approach in estimating the leading indices may not be reliable given the sharp decline in several of the components used in modeling the leading indices.
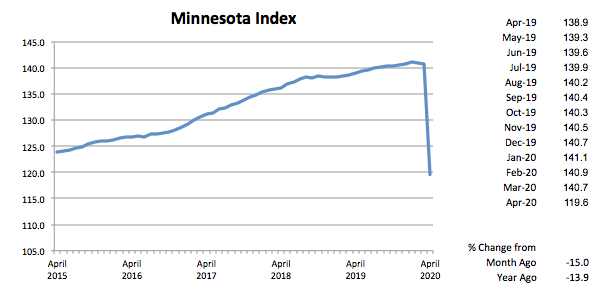
The Minnesota Index plunged 15.0 percent in April as the unprecedented partial shutdown of Minnesota’s economy to fight the spread of COVID-19 started to show up painfully in April’s economic indicators. The 15 percent monthly drop is by far the largest ever as the next largest decline was 0.9 percent in Dec 2008. The Minnesota Index is a monthly proxy for the state’s GDP so the plunge to 119.6 indicates that the state’s economic output contracted to the May 2014 level.
All components of the index recorded record monthly moves as wage and salary employment crashed, the unemployment rate rocketed up, wage and salary compensation declined steeply, and average weekly manufacturing hours dived to the lowest average hours in the 50-year history of the series.
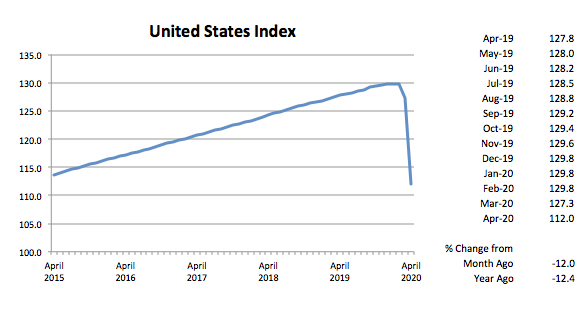
The U.S. index plunge was slightly smaller at 12.0 percent, shrinking the nation’s economic output to November 2014 level.
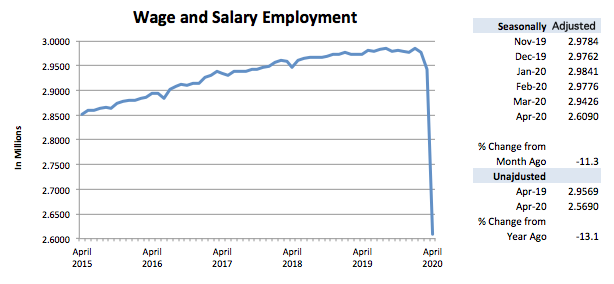
Adjusted Wage and Salary Employment declined by 333,600 jobs in April, an 11.3 percent decline. The previous record-high monthly percent decline was last month’s 1.2 percent. The largest monthly decline prior to the last two months was 0.8 percent in January 1982. Adjusted wage and salary employment nationwide declined 13.5 percent.
Job loss was heaviest in Leisure and Hospitality, the first sector to be shut down. Loss in that sector was 140,000, a 52.2 percent drop. All sectors except Mining and Logging suffered workforce reductions. Heavy job loss also occurred in Educational and Health Services (50,000), Trade, Transportation, and Utilities (34,000), Other Services (28,000), Government (24,000), and Professional and Business Services (24,000).
The unadjusted over-the-year employment decline in April was 13.1 percent, surpassing the record largest decline of 5.0 percent in September 2009. The U.S. unadjusted over-the-year decline in April was 13.2 percent.
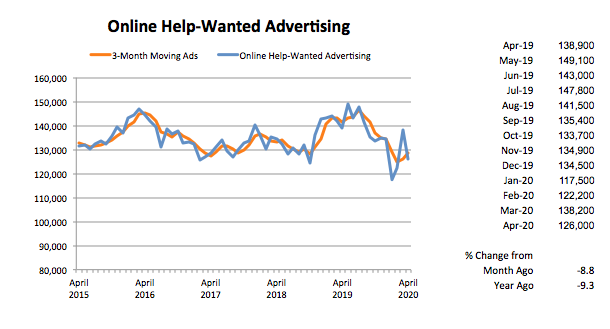
Online Help-Wanted Ads, surprisingly, dipped only 8.8 percent to 126,000. Job postings nationwide slipped 9.8 percent. Labor demand, at least as measured by online help-wanted ads, appears to have remained close to levels before the lockdown went into effect. Minnesota’s share of online job postings remained at 2.3 percent which is slightly higher than the state’s 2.0 percent share of U.S. wage and salary employment.
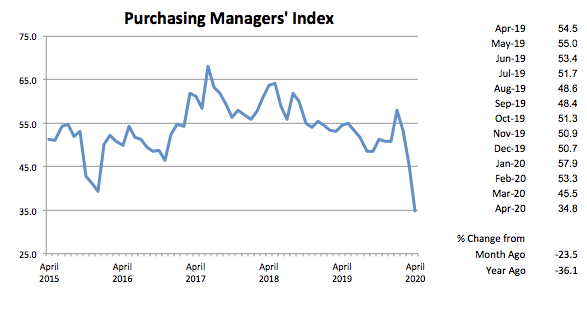
Minnesota’s Purchasing Managers’ Index (PMI) declined to 34.8 in April, indicating that Minnesota Manufacturing is contracting at a rapid rate. April’s reading, however, is not a record low as the 28.4 reading in February 2009 holds that dubious mark. The Mid-America Business Index also declined sharply to 35.1 while the national PMI dipped to 41.5. April’s low PMI reading suggests that the state’s economy will be in a recession through at least the middle of the summer.
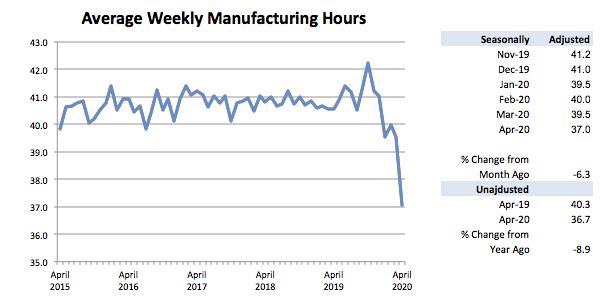
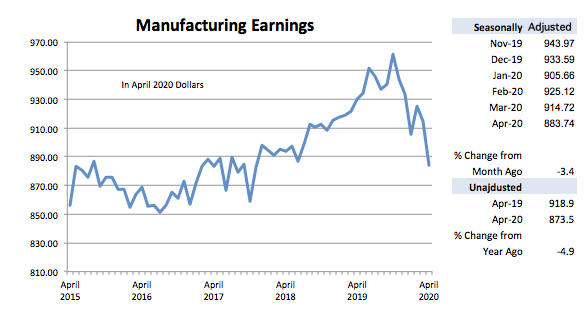
Average weekly Manufacturing Hours plummeted to 37.0 in April, the lowest average weekly factory workweek over the last 50 years. The previous low was set in April 1983 at 38.3 hours. Manufacturing Earnings, adjusted for inflation and seasonality, also declined, falling to $883.74, the slimmest paycheck since November 2017. Average weekly factory paychecks, adjusted only for inflation, are down 10.1 percent since reaching an all-time high $971.57 last October.
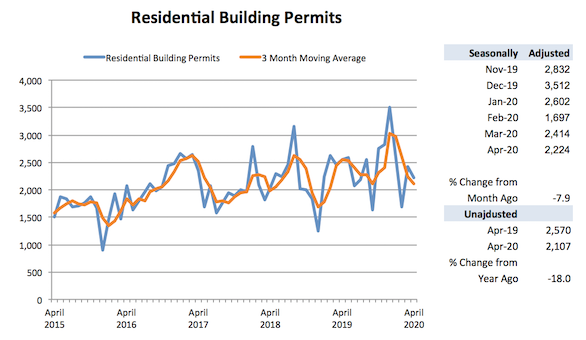
Adjusted Residential Building Permits tailed off a tad in April to 2,224. That level is just slightly above the 50-year average of 2,118. Home-building permits through the first four months of the year are running 1.5 percent ahead of the same period last year. Home building activity appears to be holding up despite the dramatic economy-wide job losses. Homebuilder sentiment nationally bounced back some in May after the sharpest one-month drop off in April.
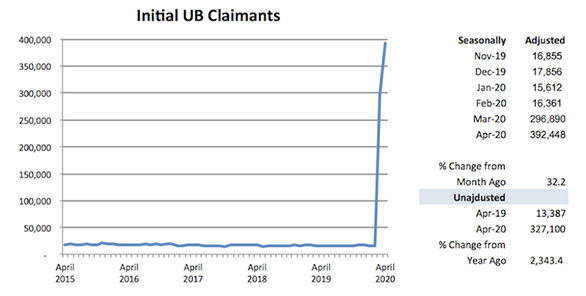
Adjusted Initial Claims for Unemployment Benefits (UB), after setting a never imagined record of 296,890 in March, skyrocketed again in April to 392,448. The two-month total of 689,338 easily exceeds the highest annual total of 467,295 recorded in 2009. The sectors with the most initial claims in April were Heath Care and Social Assistance (62,000), Retail Trade (40,800), Manufacturing (34,000), Accommodation and Food Services (32,000), and Administrative and Support and Waste Management and Remediation Services (17,000). Seasonally adjusted continuing claims jumped from 65,072 in March to 379,423 in April. Continuing claims averaged roughly 93,000 each month between 2007 and 2019. Look for a decline in continuing claims as an early indicator that the job recovery has begun.
