by Dave Senf
June 2013
Note: All data except for Minnesota's PMI have been seasonally adjusted. See the feature article in the Minnesota Employment Review, May 2010, for more information on the Minnesota Index.
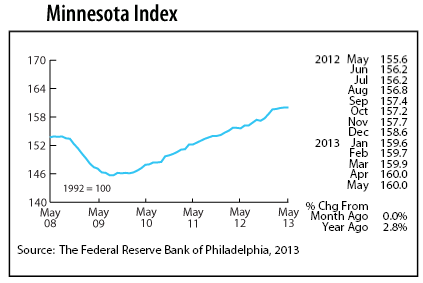
The Minnesota Index remained stuck at 160.0 for the second straight month in May despite a jump in payroll numbers. Job growth was offset by declining manufacturing hours and a flat unemployment rate. Minnesota's economy has cooled off over the last few months: The index, a proxy measure of the state's economic activity, has improved by only 0.3 percent since advancing 0.6 percent in January. The payroll employment component of the index is subject to revisions, so the recent pause in the index may eventually be revised to show more growth.
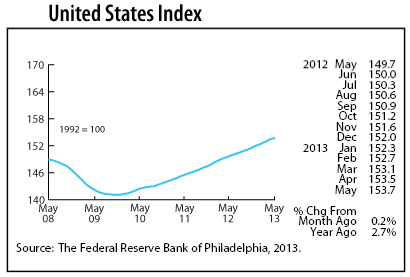
Minnesota's index has slipped behind the U.S. index. Job growth for the nation has stayed positive each month this year unlike Minnesota with two months of job loss reported since January. Minnesota's economy over the last 12 months appears to have grown just a tad faster than the national economy with Minnesota's index up 2.8 percent from a year ago compared to 2.7 percent nationally.
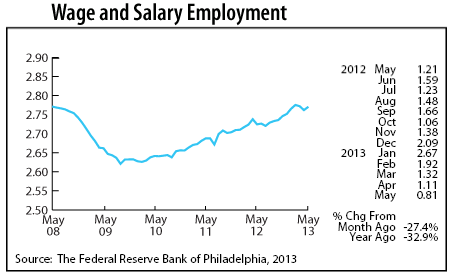
Minnesota's Wage and Salary Employment made up lost ground in May with 8,500 jobs added following 13,500 jobs lost over the previous two months. Job growth was broad-based with eight of the 11 supersectors increasing payroll totals. Leisure and Hospitality, Government, and Professional and Business Services ramped up hiring while job cutbacks mounted in Trade, Transportation, and Utilities.
May's upswing in job growth is partially from a catch-up in seasonal hiring which was delayed as a result of the miserable spring weather. Over-the-year job growth using unadjusted employment numbers for Minnesota shot up to 1.6 percent in May, matching the U.S. rate. Over-the-year job growth has averaged 1.7 percent so far this year which, if it continues, would be an improvement from the 1.4 percent annual average last year.
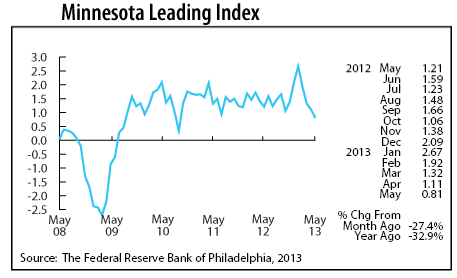
The Minnesota Leading Index has been in a free fall for the last four months after spiking to a 25-year high in January. The index slipped below 1.0 for the first time in two years in May. The index is designed to predict the pace of economic growth in Minnesota six months down the road. The downward trend is another indicator worth watching as the trend suggests Minnesota's economy will be slowing considerably toward the end of 2013.
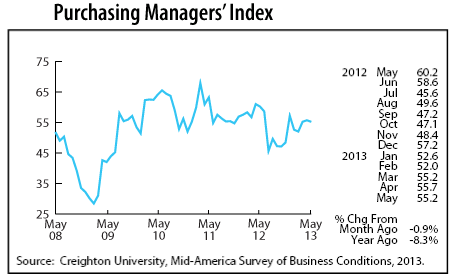
Minnesota's Purchasing Managers' Index (PMI) inched down slightly in May but remains safely in growth territory. A reading above 50 suggests growth; those below indicate contraction. Minnesota manufacturers, after strongly rebounding in 2011 and early 2012, have downshifted a gear over the last year. Minnesota manufacturers are in a somewhat stronger position than their counterparts in other parts of the country. Minnesota's PMI has been higher than the U.S. index for the last three months.
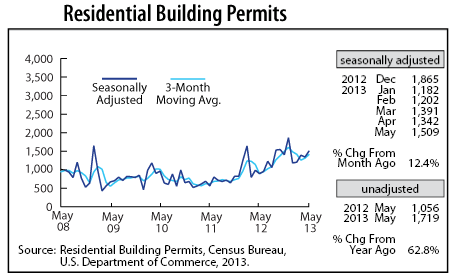
Adjusted Residential Building Permits climbed 12.4 percent in May, advancing to their highest level since last December. The housing recovery is gaining speed which will provide a boost for the overall economy.
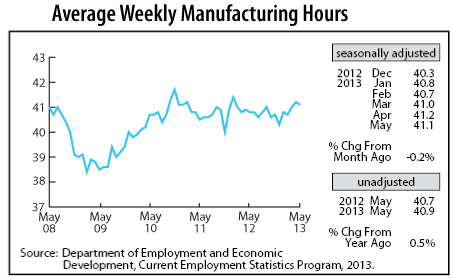
Adjusted Manufacturing Hours backed off slightly in May but remain above 41 hours per week. The factory workweek has averaged 41 hours through the first five months this year, a slight improvement from 40.7 and 40.8 hours in 2011 and 2012.
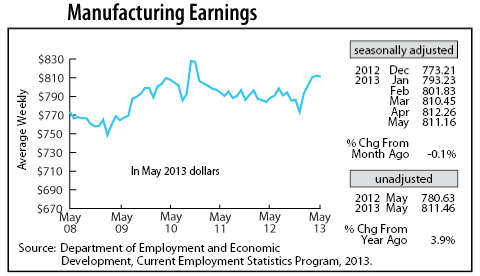
Adjusted Manufacturing Earnings also declined slightly in May but remain close to a two and a half year high. Average manufacturing earnings, after adjusting for inflation, were 3.9 percent higher than a year ago. Factory pay has outpaced the cost of living for the last four months.
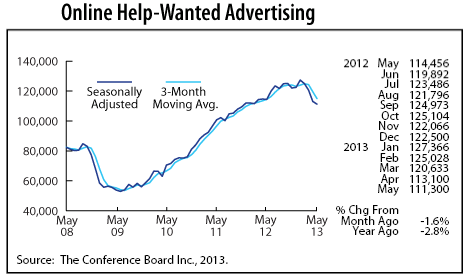
Minnesota's adjusted online Help-Wanted Ads slipped for the fourth month in a row in May, declining 1.6 percent. Online advertising also tailed off nationwide, dipping 3.0 percent. Help-wanted ads in Minnesota are down 12.6 percent from the January peak, while help-wanted advertising nationally is 5.4 percent lower over the same period. Minnesota's share of help-wanted ads has dropped from 2.5 percent to 2.3 percent of U.S. postings, still above the state's 2.0 percent share of nationwide employment. The tailing off of help-wanted ads is worth tracking since it may signal softening in hiring.
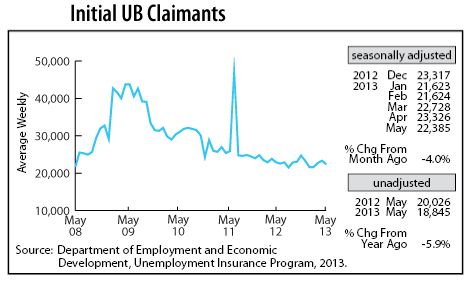
Adjusted Initial Claims for Unemployment Benefits (UB) inched down in May and continue to run at a level consistent with job growth around 1.5 percent. A persistent upward trend in initial claims over the next few months would be the best indicator that Minnesota's economy is headed for slower growth.
