by Luke Greiner
February 2015
DEED's Quarterly Census of Employment and Wages (QCEW) program provides a count of jobs and total payroll from businesses across the state. Average annual wages are calculated by dividing total payroll by the number of employees receiving wages, and are greatly influenced by each county's industry mix.
Not surprisingly, the highest wages are found in the Twin Cities metro area, with Hennepin County leading the way at $62,261. In contrast, the lowest wages tended to be found in Northwestern and Southwestern Minnesota, with the lowest wages reported in Cass County, at $26,485 per year.
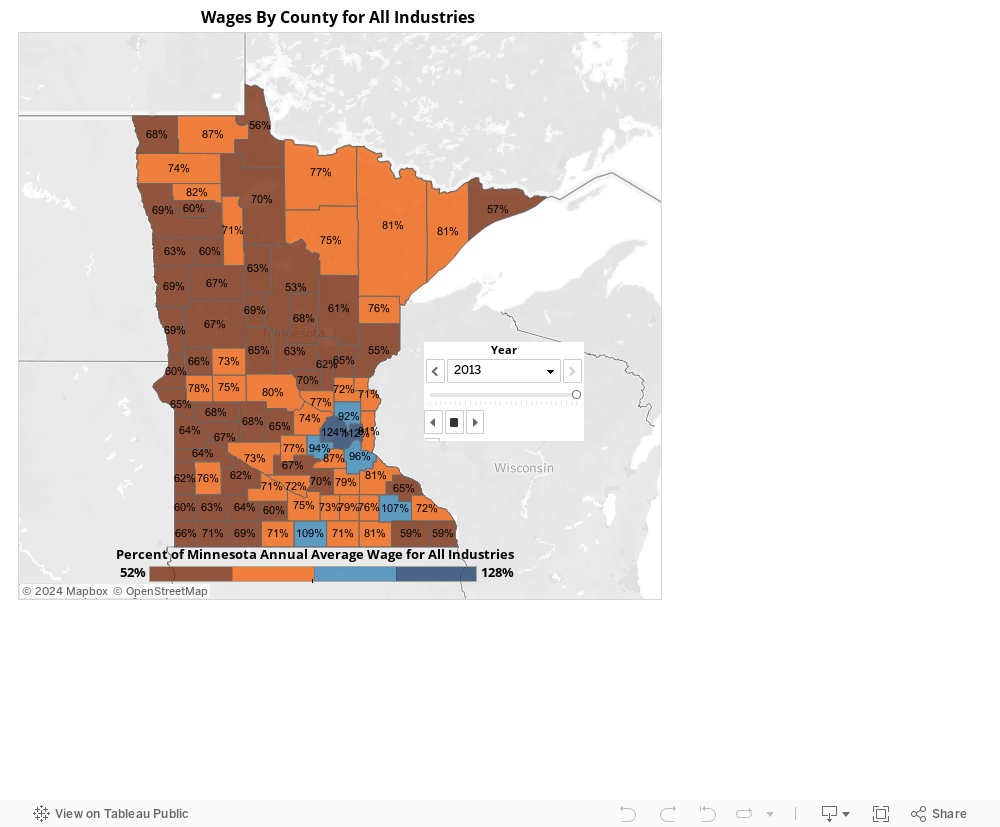
The map below shows each county's average annual wages as a percent of the state's average annual wages from 1984 to 2013. While wages in some counties have drawn closer to the state average over the last 30 years, many others in Greater Minnesota have fallen further behind the Twin Cities metro area.
Overall, statewide average annual wages have climbed from $18,041 in 1984 to $50,116 in 2013, and suffered just one year-over-year decline during the last 30 years, from 2008 to 2009.