by Dave Senf
May 2018
Note: All data except for Minnesota’s PMI have been seasonally adjusted. See the feature article in the Minnesota Employment Review, May 2010, for more information on the Minnesota Index.
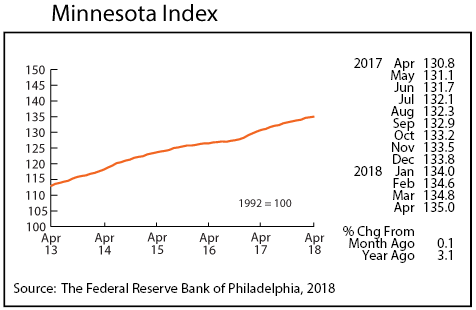
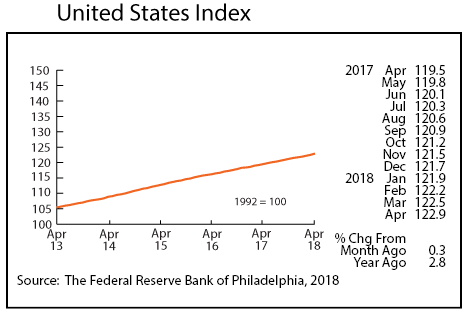
The Minnesota Index advanced for the 20th straight month in April, but the pace of growth slowed to 0.1 percent. That is the lowest monthly gain since August 2016. The U.S. index jumped 0.3 percent in April. Declining wage and salary employment along with waning average weekly manufacturing hours slowed the Minnesota Index. Minnesota’s index was up 3.1 percent over the year, beating the 2.8 percent annual increase for the national index.
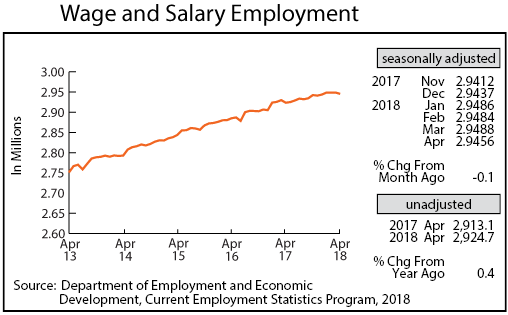
Minnesota’s adjusted Wage and Salary Employment slipped in April with 3,200 jobs lost. Job growth has been weak so far this year with 1,900 jobs created since last December compared to 18,400 jobs created over the same period in 2017. Winter-like weather in April may have delayed some of the usual spring hiring uptick. All of the job loss was in the private sector which cut 3,400 jobs while government jobs increased by 200. Job cutbacks were highest in Leisure and Hospitality and Trade, Transportation, and Utilities. Hiring was strong in Other Services and Financial Activities. Manufacturing payroll numbers were up for the fourth consecutive month.
Minnesota’s unadjusted over-the-year job growth inched down to 0.4 percent, the lowest annual rate since August 2010. The U.S. over-the-year rate stayed at 1.7 percent for the second month in a row. The 0.4 percent unadjusted over-the-year job growth rate is usually seen going into or out of a recession. This time around though the low rate may just be a product of a tightening job market. Other nearby states with as low or lower unemployment rates are also experiencing low over-the-year job growth.
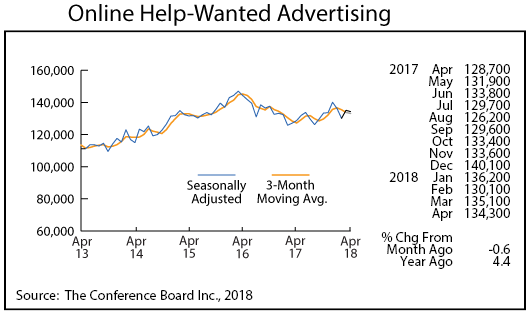
Online Help-Wanted Ads zigzagged down to 134,300 in April. The decline was a 0.6 drop compared to the 1.4 percent drop nationwide. Minnesota’s share of U.S. online job postings remains at 2.8 percent which continues to be higher than the state’s 2.0 percent share of wage and salary employment. The state’s unemployed workers to online-help-wanted ads ratio in April was 0.73, the third lowest state ratio and almost half as low as the 1.37 national ratio.
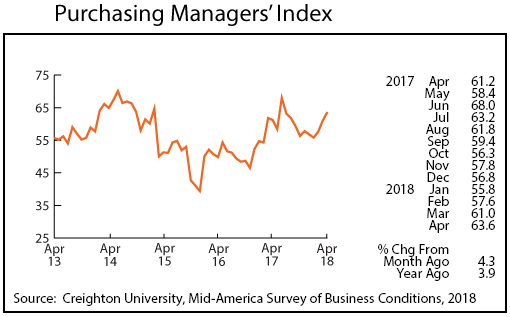
Minnesota’s Purchasing Managers’ Index (PMI) jumped for the third straight month to 63.6 in April. That is the highest reading since last July and another indicator that Minnesota’s economy remains solid even though job growth has slowed. The comparable national index moderated for the second consecutive month in April, falling to 57.3. The Mid-America Business Conditions Index, where Minnesota’s PMI comes from, rose to 64.5 in April. Minnesota is one of nine states included in the Mid-America index.
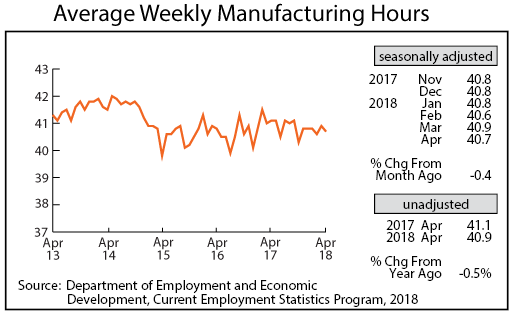
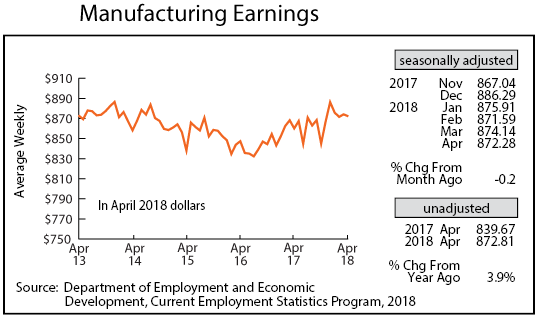
Adjusted average weekly Manufacturing Hours inched down in April to 40.7. Weekly factory hours nationally averaged 42.4 hours in April. Since the industrial classification system was revised in 2001, Minnesota and U.S. weekly manufacturing hours have averaged 40.6 and 41.1 hours respectively. Average weekly Manufacturing Earnings, adjusted for inflation, dipped slightly in April to $872.28. Real manufacturing paychecks, unadjusted for seasonality, were up 3.9 percent from a year ago. Real manufacturing earnings have been higher than a year ago since November 2016.
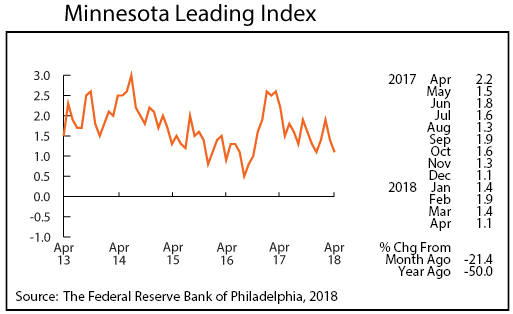
The Minnesota Leading Index slipped in April for the second straight month, declining to 1.1. The index has been headed in a downward direction for about a year now as the tightening labor market slows business expansion and economic growth. The 1.1 reading, however, points to further expansion of the state’s economy over the next six months.
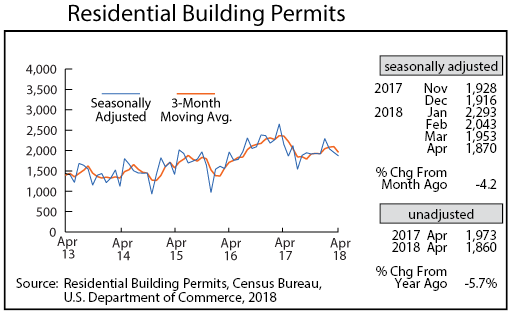
Adjusted Residential Building Permits, after getting off to a strong start in January, have dipped since falling for the third consecutive month in April to 1,870, the lowest level since last July. Home-building permits through the first four months of 2018 were down 12.6 percent from the same period a year ago. Annual home-building permits were up 15 percent in 2015 and 10 percent in 2016 but only 2 percent in 2017.
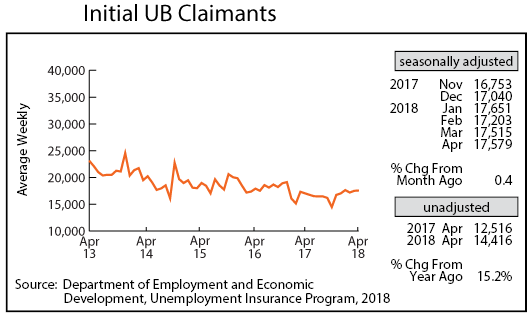
Adjusted Initial Claims for Unemployment Benefits (UB) climbed in April for the second month in a row and for the fifth time over the last six months. April’s 17,519 initial claims were just a tad higher than in March but the level of initial claims, after having decreased since 2010, have started to inch up over the last six months. Initial claim numbers, however, remain substantially below historical norms, suggesting that employers have continued to keep layoffs low in light of the tight job market.