
by Cameron Macht
March 2023
COVID-19 upended many aspects of life and work. Perhaps one of the most notable changes has been the increase in the number of people working from home. Technology advances, improved communication capabilities, and a shifting attitude toward work-life balance had already started the trend toward more remote work, but the pandemic forced organizations to radically rethink their approach, quickly allowing more employees to work from home.
What used to be the privilege of some self-employed workers, farmers, day care providers, consultants, computer and information technology experts, and other freelancers quickly became common for many other occupations due to social-distancing requirements and other pandemic- containment measures. But even after the pandemic has waned, many employers are choosing to permanently allow employees to work remotely, signaling a long-term shift in where work is done.
New data from the Census Bureau's Household Pulse Survey shows a massive rise in the prevalence of working from home across the country and state. According to survey results from February of 2023, almost one quarter of Minnesota workers worked from home at least three days each week. At that rate, Minnesota ranked 9th in the U.S. at 23.5%, well ahead of the U.S. average of 20.1%.
Interestingly, Minnesota sticks out in the Midwest for the ability to work from home, with more than double the concentration seen in North Dakota (10.2%) and nearly double South Dakota (12.6%), and well ahead of Iowa (14.5%), Nebraska (16.2%), and Wisconsin (16.7%). While Minnesota ranks 9th, all our neighboring states are in the bottom half. Wisconsin ranks 31st, Nebraska is 34th, while Iowa (40th), South Dakota (44th) and North Dakota (47th) are all in the bottom 10 (see Figure 1).
Figure 1. Percent of Workers Who Primarily Worked from Home, February 2023

Source: U.S. Census Bureau, Household Pulse Survey
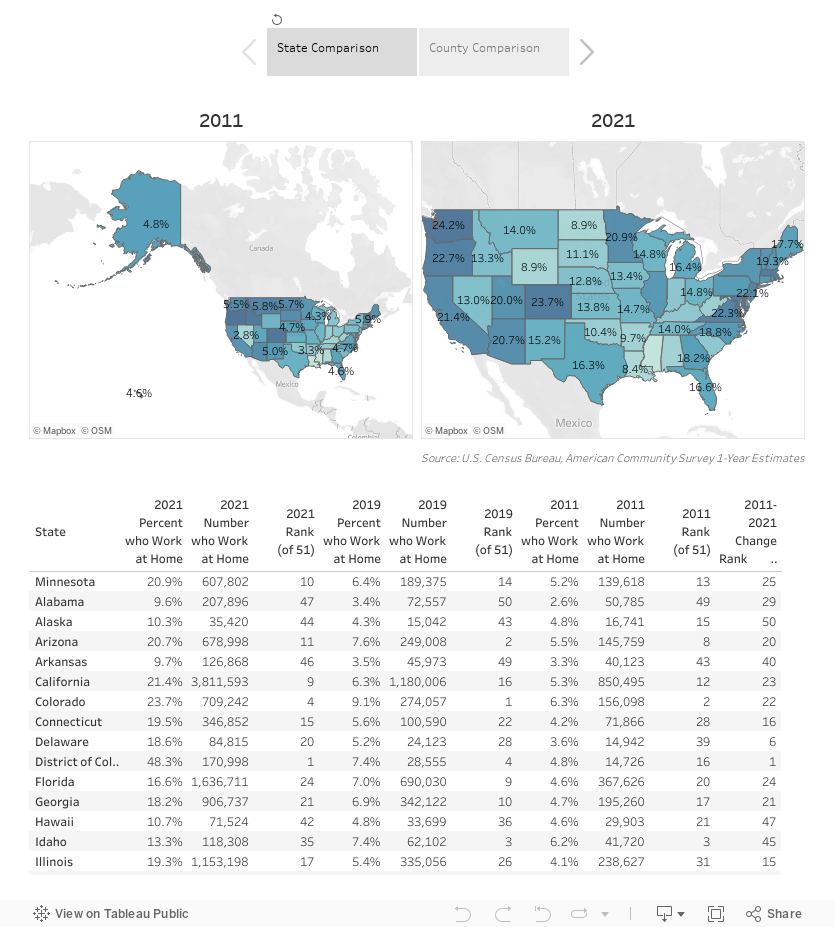
Though working from home may seem more normal now – at least in the new normal we're getting used to in 2023 – it wasn't that common even one decade ago. In 2011, about 4.3% of, or one in every 23, workers in the U.S. reported working from home. In a nation with about 138.3 million workers, that was the equivalent of about 6 million home-based workers. Minnesotans were slightly more likely to work at home – about one in every 19 workers reported working from home in 2011, amounting to about 140,000 workers. At 5.2%, Minnesota ranked 13th highest in the U.S. for remote work in 2011.
Technology advances and changing business practices allowed a slow but steady increase in work from home over the course of the decade. By 2019, the percent of U.S. workers working at home had climbed to 5.7%, an increase of more than 3 million people. Minnesota still ranked 13th in 2019 with 6.4% of workers working from home, an increase of nearly 50,000 workers.
Then from 2019 to 2021, the number and percent of workers who reported working from home exploded as the COVID-19 pandemic caused a significant rise in remote work. With many organizations forced to temporarily close their offices t o comply with social distancing guidelines and other pandemic containment guidelines, workers had to adapt quickly to working from home.
While a variety of surveys and articles pointed out these shifting behaviors, it was difficult to make a direct comparison of the actual change from pre-COVID to post-COVID. Then the Census Bureau's American Community Survey (ACS) exposed the first results from the pandemic with their 2021 1-year estimates, released in late 2022.
Census data showed that nationally, the number of people working from home more than tripled from 2019 to 2021, jumping to 27.6 million workers. At 17.9%, one in every 5.6 workers in the U.S. now reported working from home. Minnesota was still well above the national average, moving up to 9th place at 20.9%, after seeing a massive 221% increase in the number of people who worked from home between 2019 and 2021. In Minnesota, that means nearly 610,000 workers regularly worked from home the year after COVID first arrived in the U.S. (see Table 1).
| Table 1. Number and Percent of Workers Who Reported Working from Home, 2011-2021 | ||||||||||
|---|---|---|---|---|---|---|---|---|---|---|
| - | 2011 | 2019 | 2021 | Percent Change, 2011-2021 | ||||||
| - | Worked from Home | Percent | Rank | Worked from Home | Percent | Rank | Worked from Home | Percent | Rank | |
| Minnesota | 139,618 | 5.2% | 13 | 189,375 | 6.4% | 13 | 607,802 | 20.9% | 9 | +221.0% |
| United States | 5,945,609 | 4.3% | - | 8,945,657 | 5.7% | - | 27,622,238 | 17.9% | - | +208.8% |
| Source: U.S. Census Bureau, American Community Survey 1-Year Estimates | ||||||||||
As detailed in past articles looking at data from the Current Population Survey and the Household Pulse Survey, it's clear that not every industry or worker had the ability to work from home. The occupations with the largest number of people who report working from home include Management, Business & Financial Operations, and Computer or Information Technology (see Table 2). According to detailed data from the IPUMS USA database1, over 100 occupations in Minnesota had 25% or more of workers reporting that they worked at home in 2021.
| Table 2. Top 10 Occupations That Worked at Home in Minnesota, 2021 | Estimated Number of People Who Worked from Home | Percent of Total People Employed in the Occupation that Worked from Home |
|---|---|---|
| Managers, not elsewhere classified | 119,345 | 32.8% |
| Software Developers, Applications & Systems Software | 39,725 | 66.2% |
| Computer Scientists & Systems Analysts/Network systems Analysts/Web Developers | 46,767 | 49.3% |
| Management Analysts | 29,291 | 62.3% |
| Accountants & Auditors | 42,984 | 40.1% |
| Managers in Marketing, Advertising & Public Relations | 30,260 | 49.0% |
| Customer Service Representatives | 61,287 | 24.0% |
| Other Business Operations & Management Specialists | 30,933 | 46.9% |
| Financial Managers | 32,935 | 36.8% |
| Human Resources, Training & Labor Relations Specialists | 28,864 | 40.4% |
| Source: IPUMS USA, 2021 American Community Survey | ||
While these make sense now, it's interesting to note that this is also a significant shift over the course of the decade. Only Managers and Management Analysts were in the top 10 in 2011, while the rest of the past list was filled out by occupations including Farmers, Childcare Workers, Salespeople, and Personal Care Aides. People still work at home in these occupations, but they were passed in prevalence by many of these other occupations that used to be done in the office.
In contrast, many occupations still require on-site work despite the overall shift to remote work. The IPUMS data from 2021 details 325 occupations where 75% or more of workers must commute to work onsite, representing nearly 2.5 million workers in Minnesota. This includes major occupations such as Cashiers, Production Workers and Assemblers & Fabricators, Janitors & Building Cleaners, Truck Drivers, Carpenters, Healthcare Workers, and Food Prep & Serving Workers. Less than 5% of workers in each of these occupations are able to work from home.
Unfortunately, work from home data isn't available at the county level for counties with less than 50,000 people on an annual basis, which includes the vast majority of the 87 counties in Minnesota. Instead we have to rely on 5-year estimates from the ACS, with the newest data covering 2017 through 2021 released in December of 2022. Reflecting 5 years of data including the most recent year, the data show a more muted – yet already sizeable – shift in working from home following the pandemic.
The change was most apparent in the 7-county Twin Cities metro area, where the number of workers working from home more than tripled from 2011 to 2021 to 13.8%, though every region saw a rapid increase over the decade. Southeast (8.9%), Northwest (8.7%), Southwest (8.5%), and Central (8.0%) all surpassed 8.0% in 2021, meaning at least one in every 12.5 workers were now working from home.
The lowest rate was in Northeast, where 7.4% of workers reported working from home after a rapid 84.0% increase from 2011, the second fastest increase among the six regions. However, Northeast is the only region that did not see a change in rank from 2011 to 2021, consistently having the smallest share of workers at home. Ironically, the region that saw the slowest growth in working from home was Southwest, which had the highest percent in 2011 due to the higher prevalence of self-employed workers and agriculture, but had dropped to fourth by 2021 (see Table 2).
| Table 2. Number and Percent of Workers Who Reported Working from Home in Minnesota, 2011-2021 | ||||||||||
|---|---|---|---|---|---|---|---|---|---|---|
| - | 2007-2011 | 2015-2019 | 2017-2021 | Percent Change, 2011-2021 | ||||||
| - | Worked from Home | Percent | Rank | Worked from Home | Percent | Rank | Worked from Home | Percent | Rank | |
| Central | 18,153 | 5.3% | 4 | 19,037 | 5.2% | 5 | 29,518 | 8.0% | 5 | +62.6% |
| Northeast | 6,043 | 4.1% | 6 | 7,105 | 4.7% | 6 | 11,119 | 7.4% | 6 | +84.0% |
| Northwest | 15,780 | 6.0% | 3 | 18,777 | 6.9% | 1 | 23,527 | 8.7% | 3 | +49.1% |
| Southeast | 15,423 | 6.1% | 2 | 16,189 | 6.2% | 3 | 23,550 | 8.9% | 2 | +52.7% |
| Southwest | 12,896 | 6.3% | 1 | 13,835 | 6.9% | 2 | 16,983 | 8.5% | 4 | +31.7% |
| Twin Cities | 68,909 | 4.7% | 5 | 97,415 | 5.9% | 4 | 230,008 | 13.8% | 1 | +233.8% |
| Minnesota | 136,916 | 5.1% | - | 171,541 | 5.9% | - | 333,556 | 11.4% | - | +143.6% |
| Source: U.S. Census Bureau, American Community Survey 5-Year Estimates | ||||||||||
In 2011, the top four counties with the highest percentage of people working from home were small, rural counties in Southwest Minnesota that had a high concentration of self-employed workers, especially in agriculture. Between 11% and 12% of workers reported working from home in Lincoln (12.0%), Lac qui Parle (11.6%), Murray (11.3%), and Big Stone (11.1%).
Figure 2 shows that in 2011 smaller, rural counties tended to have higher percentages of people working from home, while larger metropolitan counties were less likely to allow this work arrangement, relying more heavily on onsite work. In sum, 15 of the top 30 counties for working from home in 2011 had a population below 10,000 people, and another nine had between 10,000 and 20,000 people.
The highest ranked Twin Cities metro county for working from home in 2011 was Carver, which ranked 32nd at 6.8%. In contrast, Hennepin and Scott were tied for 56th at 5.0%, while Washington (4.4%), Dakota (4.3%), and Anoka (3.6%) were all in the bottom 15 rankings for people working from home in 2011.
Though not fully reflective of the most current year because of the 5-year estimates, Figure 3 shows that the ability to work from home had rapidly shifted toward metro areas by 2021. While Rice (16.0%) and Lincoln (15.9%) still ranked in the top five, three metro counties were now there as well as Carver (15.7%), Hennepin (15.3%), and Washington (14.6%) all soared to the top. Ramsey (12.7%), Scott (12.5%), Dakota (12.4%), and Anoka (10.7%) also jumped into the top 20.
Data released in the next couple years will make the swing seem even more stark, as several of these metro counties are large enough to also have 1-year ACS estimates available to show the extent of the increase. Looking at only 2021 data, Washington County was up to 32.3%, followed by Hennepin (31.3%), Ramsey (25.3%), Scott (24.4%), Dakota (24.1%), and Anoka (20.7%), which all had at least one in every five workers reporting they worked from home.
Not surprisingly then, the seven counties of the Twin Cities metro were the top seven counties in the state when measured by the increase in the percent of workers who reported working from home from 2011 to 2021. Only Carver County did not triple the number of people who worked from home over the decade, while Hennepin and Washington County both increased more than 250%!
Overall, 76 of 87 counties in the state saw a rise in the percent of people who reported working from home over the decade. Outside the Twin Cities, another eight counties more than doubled the number of remote workers, including Olmsted, Clay, Sherburne, Chisago, Wright, Pennington, Blue Earth, and St. Louis County.
Of the 11 counties that saw a decline, 10 were small, rural counties, seven of which were located in Southwest Minnesota. This is likely due to a decline in the number of farmers and in-home daycares, both of which have been in long-term decline, but the latter of which was also severely impacted during the pandemic.
|
Figure 2. Percent Working from Home, 2011
Source: 2007-2011 American Community Survey |
Figure 3. Percent Working from Home, 2021
Source: 2017-2021 American Community Survey |
While many of these smaller, rural counties started with an advantage in the ability to work from home, many did not see the same increases in the current economic environment. This reflects a variety of factors, including industry and occupation mix, employer location, broadband availability, educational attainment, and personal choices.
One of the key drivers of the rise in remote work has been the development of new technologies that make it easier to work from home. With the availability of high-speed internet, video conferencing, and cloud-based storage and software solutions, it has become possible for many workers to perform their jobs from almost anywhere. And that means employers can be more flexible when hiring, broadening their talent pool for certain occupations that don't need to be done onsite.
Another factor contributing to the rise in remote work is changing attitudes towards work-life balance and productivity when working from home. Many workers today are looking for ways to achieve greater flexibility and control over their schedules, allowing them to balance their work and personal responsibilities more effectively. If managed correctly, remote work can provide an ideal solution for these individuals.
Despite the many benefits of working from home, there are also some challenges that come with this approach. One of the biggest challenges that employers face is ensuring that remote workers remain productive and engaged, as they may face distractions and isolation when working from home. To address these issues, organizations must be intentional and adaptable to provide their remote workers with the tools and support they need to be able to perform their work while staying connected and engaged with their co-workers.
In conclusion, the rise of remote work is a trend that is likely to continue in the years ahead. While there are certainly challenges associated with this approach, the benefits of greater flexibility, work-life balance, and access to a wider talent pool make it an appealing option for both workers and employers. The appeal of remote work for employees may continue to drive more employer policies allowing the practice as a way to attract talent in our tight labor market. As companies continue to adapt to the changing nature of work, working from home is likely to play an increasingly important role in the modern workplace.
Below is an overview of how Minnesota compares to other states, and how individual counties compare within Minnesota, regarding percentages of residents working from home.
1Steven Ruggles, Sarah Flood, Ronald Goeken, Megan Schouweiler and Matthew Sobek. IPUMS USA: Version 12.0 [dataset]. Minneapolis, MN: IPUMS, 2022.


