by Carson Gorecki
June 2023
Minnesota's economy is projected to add 28,623 jobs between the end of 2022 and end of 2023, a 0.9% increase. In the context of the recovery from the coronavirus pandemic, the projected percent employment change is slower than the previous two years and more in line with employment growth seen before 2020 (see Figure 1).

As detailed in past articles, Minnesota's labor force limitations have been a constraint on employment growth. As of the end of 2022, 36,700 fewer people were working or looking for work in the state compared to 2020. Despite an increase from 2021, the 2022 labor force participation rate (68.1%) was 1.7 percentage points lower than in 2019. At the same time, demand for workers remained high and unemployment reached historic lows, indicating that those looking for work were, to a large extent, able to find it. As a result, slow labor force growth will likely remain a primary factor in restraining employment growth in the state. An estimated 161,109 openings will be created via exits from the labor force and newly formed jobs
The sectors that are expected to grow the fastest include some service sectors that were among the hardest hit during the pandemic and are continuing to rebound. Leading the growth by industry sector were Accommodation and Food Services, Transportation and Warehousing, and Arts, Entertainment and Recreation. Some other sectors such as Professional and Technical Services have fared well throughout and are expected to continue their relatively strong run of employment growth.
Four sectors were projected to have employment declines, three of which are in or closely connected to the natural resources domain. The estimated decrease in Information employment represents a continuation of a longer-term trend of employment loss (see Figure 2).

Source: DEED Employment Outlook
Employment projections by occupational group provide some additional detail for job seekers. In addition to the estimated net employment change, the occupational numbers include a breakdown of openings by type. By adding the expected total employment change, which is either new jobs added or jobs lost, to the total number of openings created by workers leaving the labor market entirely, we get a better estimation of the overall churn within a given occupational group. Using these two measures, it becomes clear that newly created jobs are in fact the minority of openings, representing 18% of the jobs predicted to open up over a year.
Instead, there are also openings created by workers leaving one occupational field for another. These are called replacement or transfer openings and are a bit limited in their ability to describe the full turnover story because they reflect only the number of workers leaving an occupation and do not include the number that switch to an occupation.
The mix of newly created or lost jobs is also expected to vary by occupational group. Occupational groups with higher turnover such as Sales, Food Preparation and Serving Related, and Office and Administrative Support have higher shares of labor market exit openings (see Figure 3).
The higher numbers of labor market exit openings also reflect the size of the occupational group as well as the typical retirement age. If there are more jobs, then there are also more jobs from which workers can quit or leave. Since a large portion of labor market exits take the form of retirements, occupations with older workers (or a larger share of workers closer to retirement age) are more likely to see higher labor market exits.

Source: DEED Employment Outlook
The occupational groups expected to see the fastest growth over the year are Healthcare Support, Food Preparation and Serving Related, Architecture and Engineering, and Transportation and Material Moving occupations. Healthcare Support is projected to grow the fastest, adding 3,098 new jobs, an expansion of 1.8%.
Only Office and Administrative Support occupations are expected to see a net job loss, but they are also expected to have continued demand for workers via a high number of labor market exit openings. The slowest growing occupational groups are expected to be Production (0.4%), Farming, Fishing, and Forestry (0.6%), and Protective Service (0.6%). Automation is expected to play an increasing role in occupations that perform repetitive tasks including many in Production and Office and Administrative Support, which may lead to slowing growth and less demand in future years.
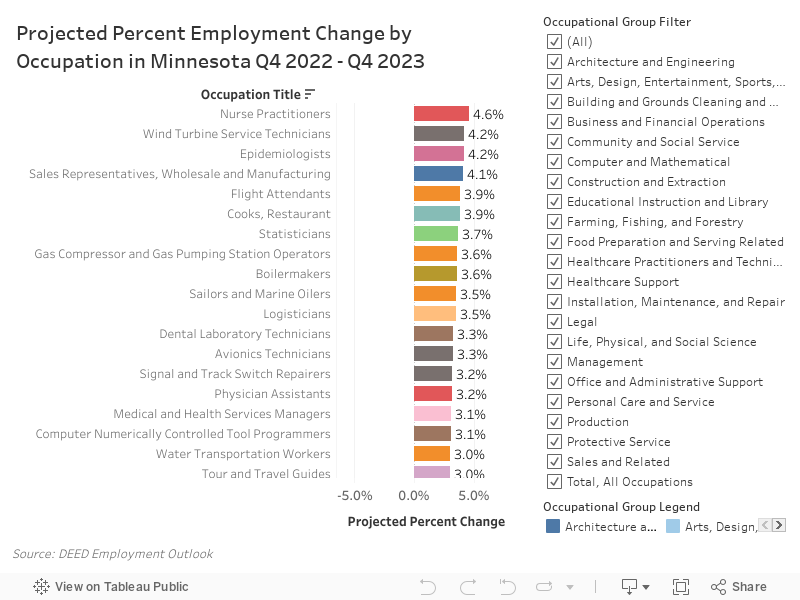
By detailed occupation, the highest employment growth is spread across a diverse array of work types. The occupation expected to grow the fastest is Nurse Practitioners at 4.6%. Next are Epidemiologists (4.2%), Wind Turbine Service Technicians (4.2%), Flight Attendants (3.9%), and Cooks, Restaurant (3.9%) (see visualization below). Among the five occupations expected to grow the fastest are a combination of public health and healthcare, jobs supporting the transition to renewable energy sources, and service jobs still recovering in the hard-hit sectors of Leisure and Hospitality and Transportation.
Eight of the 30 occupations expected to grow the fastest belong to the Transportation and Material Moving occupational group. The Production and Computer, Installation, Maintenance and Repair, and Mathematical occupational groups each have four detailed occupations among the 30 fastest growing as well. The detailed occupations expected to have the highest number of net employment change are Home Health and Personal Care Aides (2,290), Cooks, Restaurant (935), General and Operations Managers (811), Fast Food and Counter Workers (779).
At the other end of the spectrum are good examples of occupations that involve repetitive tasks most vulnerable to automation: Word Processors and Typists, Data Entry Keyers, Switchboard Operators, and Meat Cutters and Trimmers. The detailed occupations projected to net the largest employment losses are Secretaries and Administrative Assistants, Except Legal (194), Executive Secretaries and Executive Administrative Assistants (186), Miscellaneous Assemblers and Fabricators (110), and Postal Service Mail Carriers (88). The Office and Administrative Support and Production occupational groups are well-represented among the occupations expected to lose jobs over the year. Of the 20 with fastest projected employment declines, 12 are Office and Administrative Support and 5 are Production. Employment projections and estimations will continue to adjust to incorporate and capture the constantly evolving relationship between economic growth, technology, and workers.