by Tim O'Neill
December 2020
Recently released data from the U.S. Census Bureau's American Community Survey (ACS) allows us to analyze income and poverty through 2019. Such data reveals disparities in the Seven-County Metro Area, especially as the region copes with the effects of COVID-19.
According to 2015-2019 ACS five-year estimates, the Seven-County Metro Area had a median household income of $80,485. This was 12.9% higher than the median household income for the State of Minnesota, $71,306, and 28.1% higher than the nation's median household income, $62,843. Zooming in, median household incomes varied significantly by county in the Metro Area:
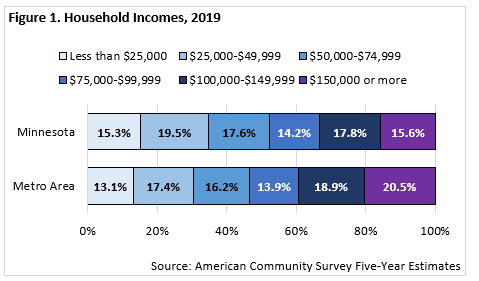
Median income is the "amount which divides the income distribution into two equal groups, half having incomes above the median, half having incomes below the median." So while the median household income in the Metro Area is higher than in the state and nation, a significant number of households have lower incomes in the region. For example, 30.5% of households in the Metro Area have incomes lower than $50,000. This represents an estimated 362,000 households of the region's total 1.2 million households. Over one-in-10 households (13.1%) in the region have incomes lower than $25,000. This represents an estimated 156,000 households (Figure 1).

When compared with Minnesota as a whole, the Metro Area accounted for 47.6% of the state's households with median incomes less than $50,000. This share increased as median household incomes rose. For example, the region accounted for 51.5% of the state's households with median incomes between $50,000 and $99,999, 57.7% of the state's households with incomes between $100,000 and $149,000, and 71.2% of the state's households with median household incomes of $150,000 or more. Overall, the Metro Area accounts for 54.3% of Minnesota's 2.2 million households.
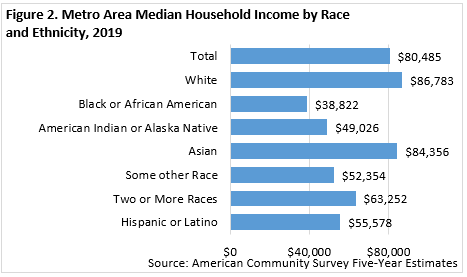
Breaking down household income by race and ethnicity reveals a greater understanding of income disparities in the region. The Black or African American median household income in the Metro Area, $38,822, was nearly $48,000 lower than the white median household income in the region. Median household incomes were also significantly lower for those reporting as American Indian and Alaska Native, those reporting as some other race, those reporting two or more races, and those reporting Hispanic or Latino origins. Only those reporting as white or Asian had median household incomes above the respective income for the total population (Figure 2).

While median household incomes in the Seven-County Metro Area are higher than they are in Minnesota, the cost of living is also higher. According to DEED's Cost of Living Calculator, a typical family of three would need to earn $61,536 in the Metro Area to meet a basic-needs budget for health and safety. The typical family consists of one full-time working adult, one part-time working adult, and one child. To meet the annual earnings of $61,536, each working adult in the family would need to earn an hourly wage of $19.72. The typical family in the Metro Area needs to earn $4,764 more per year than such a family statewide to meet basic needs. With the statewide figure being pushed up by the Metro Area, it is more revealing to see that the typical family in the Metro Area needs to earn as much as $14,448 more per year than such a family in Southwest Minnesota or $10,752 more per year than such a family in Northeast Minnesota (Table 1).
To meet a basic needs budget for health and safety, an individual in the Metro Area would need to earn $33,180 per year or $15.95 per hour. This was slightly more than the basic needs cost of living in Central Minnesota and statewide, but considerably more than other planning regions in the state. Generally, monthly costs in the Metro Area were higher than the state for childcare, food, housing, taxes, and other necessities, which includes apparel, personal care products and services, reading, education, and miscellaneous items.
| Table 1. Basic Needs Cost of Living Estimates, 2019 | |||||||||
|---|---|---|---|---|---|---|---|---|---|
| Typical Family: 2 Adults (1 working full-time, 1 part-time), 1 child | Family Yearly Cost of Living | Hourly Wage Required | Monthly Costs | ||||||
| Child Care | Food | Health Care | Housing | Transportation | Other | Taxes | |||
| Minnesota | $56,772 | $18.20 | $516 | $769 | $593 | $1,033 | $755 | $505 | $560 |
| Twin Cities Metro | $61,536 | $19.72 | $689 | $779 | $550 | $1,172 | $733 | $547 | $658 |
| Central Minnesota | $54,468 | $17.46 | $353 | $749 | $609 | $987 | $841 | $487 | $513 |
| Southeast Minnesota | $51,648 | $16.55 | $358 | $757 | $659 | $862 | $760 | $454 | $454 |
| Northeast Minnesota | $50,784 | $16.28 | $307 | $755 | $659 | $854 | $767 | $451 | $439 |
| Northwest Minnesota | $48,564 | $15.57 | $250 | $757 | $659 | $771 | $791 | $428 | $391 |
| Southwest Minnesota | $47,088 | $15.09 | $227 | $763 | $659 | $780 | $709 | $433 | $353 |
| Single Adult, 0 children | Single Yearly Cost of Living | Hourly Wage Required | Monthly Costs | ||||||
| Child Care | Food | Health Care | Housing | Transportation | Other | Taxes | |||
| Minnesota | $31,392 | $15.09 | $0 | $336 | $157 | $798 | $653 | $318 | $354 |
| Twin Cities Metro | $33,180 | $15.95 | $0 | $340 | $151 | $911 | $635 | $351 | $377 |
| Central Minnesota | $31,800 | $15.29 | $0 | $327 | $159 | $769 | $722 | $307 | $366 |
| Northeast Minnesota | $28,860 | $13.88 | $0 | $330 | $166 | $650 | $663 | $275 | $321 |
| Southeast Minnesota | $28,719 | $13.81 | $0 | $331 | $166 | $647 | $657 | $274 | $318 |
| Northwest Minnesota | $27,948 | $13.44 | $0 | $331 | $166 | $584 | $682 | $256 | $310 |
| Southwest Minnesota | $27,228 | $13.09 | $0 | $321 | $196 | $599 | $616 | $258 | $299 |
| Source: DEED Cost of Living Calculator | |||||||||
The Seven-County Metro Area has a higher median household income than the state. However, this one data point hides the challenges that face many households within the region. As previously mentioned, nearly one-third of the region's households have incomes less than $50,000, which is less than the basic needs cost of living for a typical family of three. Over one-tenth of households have incomes less than $25,000, which is less than the basic needs cost of living for an individual.
Along with household income and cost of living, poverty status can be determined from the American Community Survey. Poverty status is based on specific income thresholds for individuals, families, and those living with nonrelatives. These thresholds are lower than the basic needs cost of living as determined by DEED's Cost of Living Calculator. For example, the 2019 American Community Survey poverty threshold for an individual under 65 years is $13,300. For a family of three with two adults and one child, the threshold is $20,578. The same thresholds are used throughout the United States and are updated annually for inflation using the Consumer Price Index (CPI).
As of 2019 the poverty rate in the Metro Area was 9.0%, which represented approximately 270,588 people living in poverty. While poverty in the Metro Area is lower than at the state and national levels, stark disparities appear when we analyze poverty by demographics. For example, the poverty rate for Black and African Americans in the Metro Area, 26.5%, is nearly five times higher than the poverty rate for the white population in the region (Table 2).
| Table 2. Metro Area Poverty by Race and Ethnicity, 2019 | ||||
|---|---|---|---|---|
| Population | Total Population | Below Poverty Level | Percent Below Poverty Level | Minnesota Percent Below Poverty Level |
| Total Population | 3,016,849 | 270,588 | 9.0% | 9.7% |
| White | 2,297,572 | 130,081 | 5.7% | 7.3% |
| Black or African American | 293,001 | 77,642 | 26.5% | 28.6% |
| American Indian or Alaska Native | 16,702 | 4,652 | 27.9% | 31.3% |
| Asian | 227,033 | 29,689 | 13.1% | 13.6% |
| Some other Race | 72,494 | 13,038 | 18.0% | 19.7% |
| Two or more Races | 109,000 | 15,415 | 14.1% | 16.3% |
| Hispanic or Latino (of any race) | 192,547 | 32,491 | 16.9% | 18.6% |
| Source: 2019 American Community Survey Five-Year Estimates | ||||
Poverty rates in the Metro Area were also higher for younger persons and females. For example, the poverty rates for those under 35 years of age were nearly twice as high as such rates for those over the age of 35. Nearly one-in-10 females in the Metro Area were living below the poverty level in 2019. The poverty rate for females was about 1.2 times higher than the poverty rate for males in the region (Table 3).
| Table 3. Metro Area Poverty by Age and Gender, 2019 | ||||
|---|---|---|---|---|
| Population | Total Population | Below Poverty Level | Percent Below Poverty Level | Minnesota Percent Below Poverty Level |
| Total Population | 3,016,849 | 270,588 | 9.0% | 9.7% |
| Under 18 years | 710,016 | 83,233 | 11.7% | 12.2% |
| 18 to 34 years | 702,671 | 81,954 | 11.7% | 13.5% |
| 35 to 64 years | 1,199,894 | 78,551 | 6.5% | 7.0% |
| 65 years and over | 404,268 | 26,850 | 6.6% | 7.2% |
| Gender | ||||
| Male | 1,489,097 | 122,138 | 8.2% | 8.8% |
| Female | 1,527,752 | 148,450 | 9.7% | 10.6% |
| Source: 2019 American Community Survey Five-Year Estimates | ||||
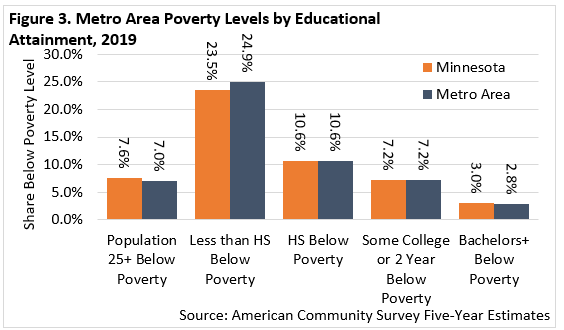
Poverty rates can also be broken down by educational attainment and employment status. For those 25 years of age and older in the Metro Area, nearly one-quarter of those with less than a high school diploma were living below the poverty level. For those with a high school diploma or equivalent, about one-in-10 were living below the poverty level. This rate decreased further to 7.2% for those with some college or a two-year degree, and 3.0% for those with a bachelor's degree or more (Figure 3).

Overall poverty rates varied within the Metro Area by county:
The data on income and poverty in this article reflect a period in the Metro Area and Minnesota before the COVID-19 pandemic and current recession. During the course of 2020 the region lost nearly 237,000 jobs, the unemployment rate spiked to 10.1%, and more than 638,000 people applied for unemployment insurance. Labor market data also reveal that the current recession is disproportionately affecting people of color, those with less educational attainment, younger people, and women – all populations that had higher poverty rates before the pandemic in 2019.