by Dave Senf
July 2014
Note: All data except for Minnesota's PMI have been seasonally adjusted. See the feature article in the Minnesota Employment Review, May 2010, for more information on the Minnesota Index.
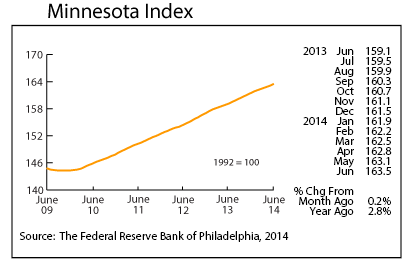
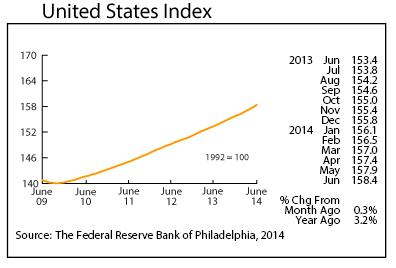
The Minnesota Index increased 0.2 percent for the seventh straight month in June. The U.S. Index increased 0.3 percent for the fifth month in a row last month. Minnesota's index has lagged behind the U.S. index since February. Slower job growth during the first few months of the year slowed the Minnesota index. Minnesota's index advanced 1.2 percent over the first half of the year compared to a 1.5 percent advance for the U.S. index. Minnesota's index increased 1.3 percent over the first half of 2013 while the U.S. index increased 1.7 percent.
Despite the lower readings during the first half of 2013, Minnesota's real GDP increased 2.8 percent in 2013, significantly outpacing the 1.9 percent national increase. Private sector GDP growth in Minnesota was even stronger last year, climbing 3.1 percent compared to the U.S. private sector GDP gain of 2.3 percent. Minnesota's real GDP expansion last year ranked 13th highest among the states. The Minnesota Index is a monthly proxy for the state's economic growth but is subject to significant revisions as more reliable data become available.
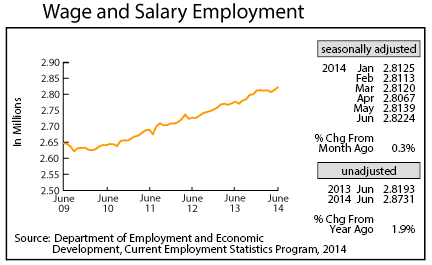
Minnesota's adjusted Wage and Salary Employment recorded its second straight month of solid growth in June, adding 8,500 workers. Private sector employment increased 4,600 while public sector jobs jumped 3,900. All job gains were on the service-providing side as goods-producing employment dropped slightly. Educational and Health Services along with Trade, Transportation, and Utilities added the most jobs. Job cutbacks were significant in Other Services. Staffing additions in local government units accounted for all public sector job expansion.
Minnesota job growth over the year raced up to 1.9 percent, matching the national pace for the first time since February. Minnesota's over-the-year job growth rate through the first six months of 2014 has averaged 1.7 percent which also matched the U.S. growth rate. Minnesota's annual average job growth rate was also 1.7 percent as was the 2013 U.S. job growth.
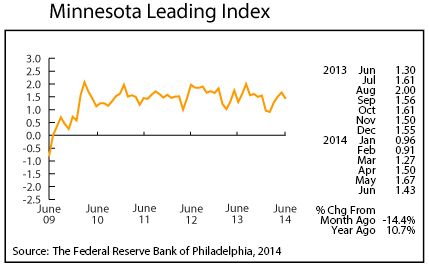
After rising during the previous three months, the Minnesota Leading Index tailed off in June, sliding to 1.43. June's reading is roughly equal to the 1.34 average monthly reading over the last five years. The 1.4 level translates into a predicted 1.4 percent increase in the state's economic activity over the next six months.
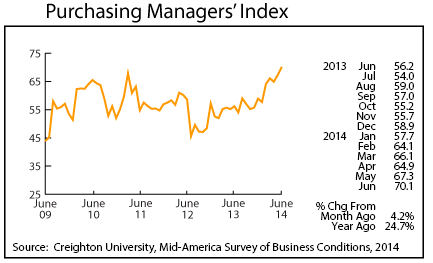
Minnesota's Purchasing Managers' Index (PMI) climbed for its sixth time in the last eight months in June, soaring to its third highest reading on record. June's 70.1 level implies that Minnesota manufactures are extremely optimistic about business activity over the next few months. The nine-state Mid-American Index which includes Minnesota was 60.6 in June while the corresponding national index was 55.3. The slight loss of manufacturing jobs in June was surprising since the employment component of the index continues to run strong, reaching 59.6 in June. The upward direction of Minnesota's Purchasing Managers Index over the last couple of months indicates that manufacturing hiring will be picking up in the near future.
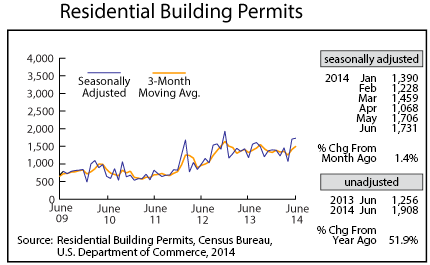
Adjusted Residential Building Permits inched up in June to 1,731. Compared to last June's level - 1,178 - building permits are up but not as much as was hoped for at the start of the year. The recovery road for Minnesota's home-builders continues to be a long slow climb.
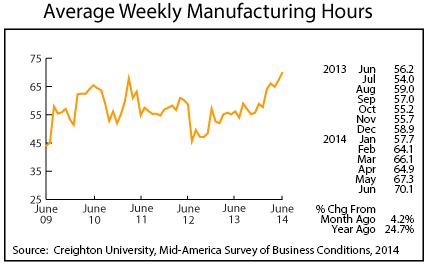
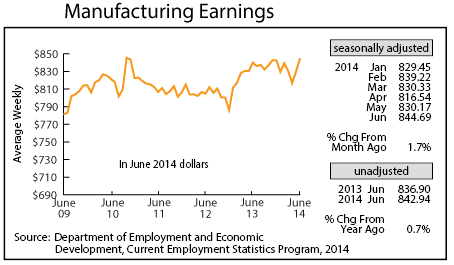
Adjusted Manufacturing Hours remained at an elevated level in June, offering more evidence that Minnesota's manufacturing sector has shifted gears and is expanding at a fast clip. Manufacturing may be adding workers through the temporary-help industry. Workers added through temp agencies would not be showing up in manufacturing payroll numbers. After dropping during the previous two months, Manufacturing Earnings soared to an $844.69 average weekly paycheck in June. That is the highest paycheck since October 2010.
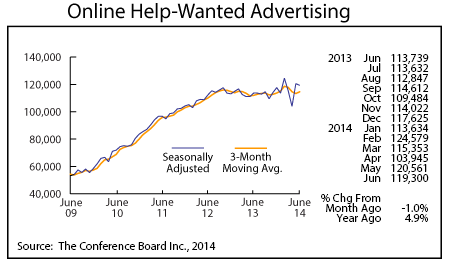
Minnesota's adjusted online Help-Wanted Ads slipped slightly in June, dipping 1.0 percent. U.S. help-wanted advertising climbed 3.2 percent. Minnesota's share of online help-wanted ads came in at 2.4 percent in June which is still higher than the state's 2.0 percent share of national employment. The higher help-wanted share suggests that labor demand in Minnesota continues to be at least as strong as, if not stronger than, national demand.
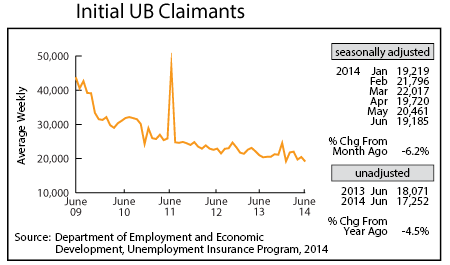
Adjusted Initial Claims for Unemployment Benefits (UB) dipped slightly in June, finishing below 20,000 for the third time this year. Initial claims averaged 20,400 during the first half of the year compared to 22,000 during the same period last year. That's a 7.2 percent decline which points towards Minnesota's job growth remaining in the 1.6 - 1.8 percent range for the rest of the year.